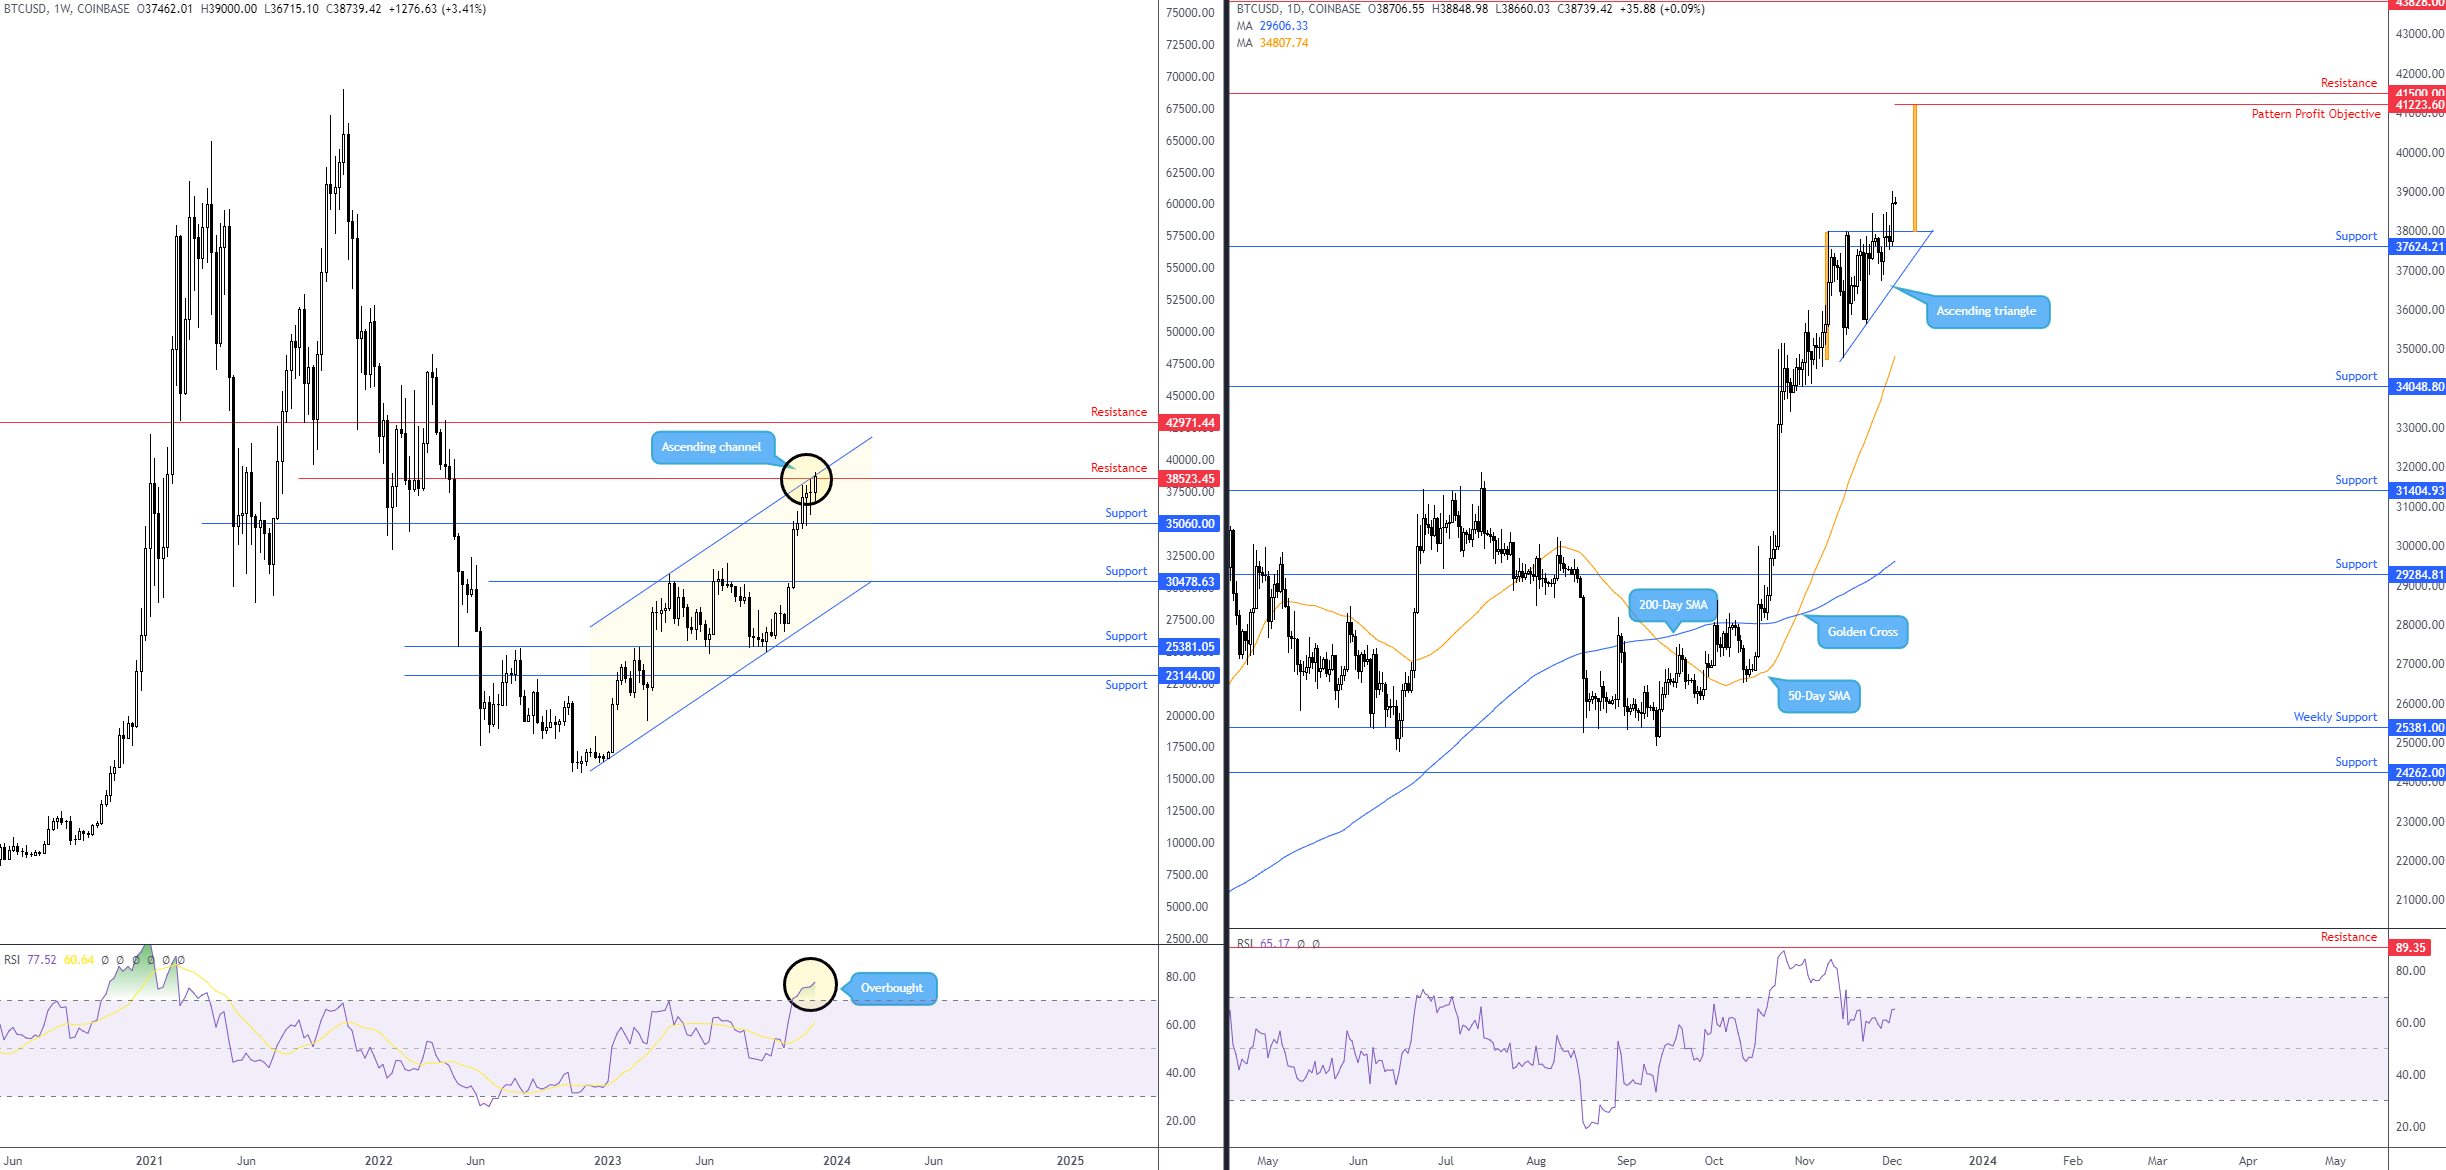
BTC/USD: Ascending triangle completed

Against the US dollar, the price of Bitcoin staged another advance last week, adding +3.4% at the time of writing.
Technical headwinds on the weekly chart
Technical headwinds remain on the weekly timeframe. This includes the channel resistance that recently made its way into the fight, extended from the high of $31,050, an ascending channel resistance accompanied by nearby resistance at $38,523 and the Relative Strength Index (RSI) testing overbought levels (highest since early 2021).
So, despite the weekly timeframe trending higher since late 2022, there is clear resistance in play here.
Ascending triangle breach on the daily timeframe exposes upside objective
From the daily timeframe, the key technical observation, particularly for chart pattern enthusiasts, is the ascending triangle pattern formed between $34,758 and $37,999 in a market trending higher. Ascending triangles are recognised as continuation chart patterns within uptrends (traders tend to buy the breakout above its upper limit and project a profit objective using its base value, which, in this case, is $41,223). You will note that price tunnelled through the upper boundary of the ascending triangle last week, effectively handing the baton to breakout buyers. You will also see that support at $37,624 was recently retested (prior resistance), movement adding weight to the upside breakout.
Technically speaking, from the daily timeframe, buyers are likely to remain in the driving seat until reaching $41,223, a profit objective sheltered south of daily resistance at $41,500.
This week?
While the breakout above the daily timeframe’s ascending triangle delivers a bullish signal alongside a market trending higher, the weekly timeframe’s resistance is a concern for bulls. Consequently, even if price continues to navigate higher levels this week, the road will likely be bumpy.
An alternative scenario is that we see pattern failure on the daily chart and price dips back under support at $37,624. This—coupled with weekly resistances—could nudge the unit back towards weekly support at $35,060 and daily support at $34,048 (alongside the 50-day SMA at $34,807).
Charts: TradingView
Author

Aaron Hill
FP Markets
After completing his Bachelor’s degree in English and Creative Writing in the UK, and subsequently spending a handful of years teaching English as a foreign language teacher around Asia, Aaron was introduced to financial trading,


