BNB, SOL, DOGE bounce back as Bitcoin ends the two-day slump
- BNB risks a reversal after hitting a new record high of $883 on Thursday.
- Solana holds the 6% rise from Wednesday, with bulls eyeing the $200 milestone.
- Dogecoin bounced nearly 6% off the 200-day EMA amid the impending Golden Cross.

Top cryptocurrencies such as BNB (BNB), formerly known as Binance Coin, Solana (SOL), and Dogecoin (DOGE) are back in the green with a nearly 4% rise in the last 24 hours as Bitcoin (BTC) halts the two-day slump with a 1.24% jump on Wednesday. BNB hits a record high with bulls anticipating a breakout rally, while SOL and DOGE lift off from crucial moving averages.
BNB hits record high amid increasing risk of profit booking
BNB token trades at $867 at press time on Thursday as it retraces from the all-time high of $883 earlier in the day. The residual bullish momentum from the 5.45% rise on Wednesday tests the R1 pivot resistance level at $881.
Sideline investors could find the decisive close above this level as a buy signal, with the R2 pivot resistance level at $980 as the primary target.
The momentum indicators warn of a potential cooldown in the elevated bullish momentum. The flat-moving Relative Strength Index (RSI) reads 65 on the daily chart below the overbought boundary, risking a bearish turnaround as traders contemplate profit-booking.
Additionally, the Moving Average Convergence Divergence (MACD) and its signal line are moving close to each other, indicating low bullish momentum. A drop in the MACD below its signal line would trigger a sell signal, resurfacing bearish momentum.
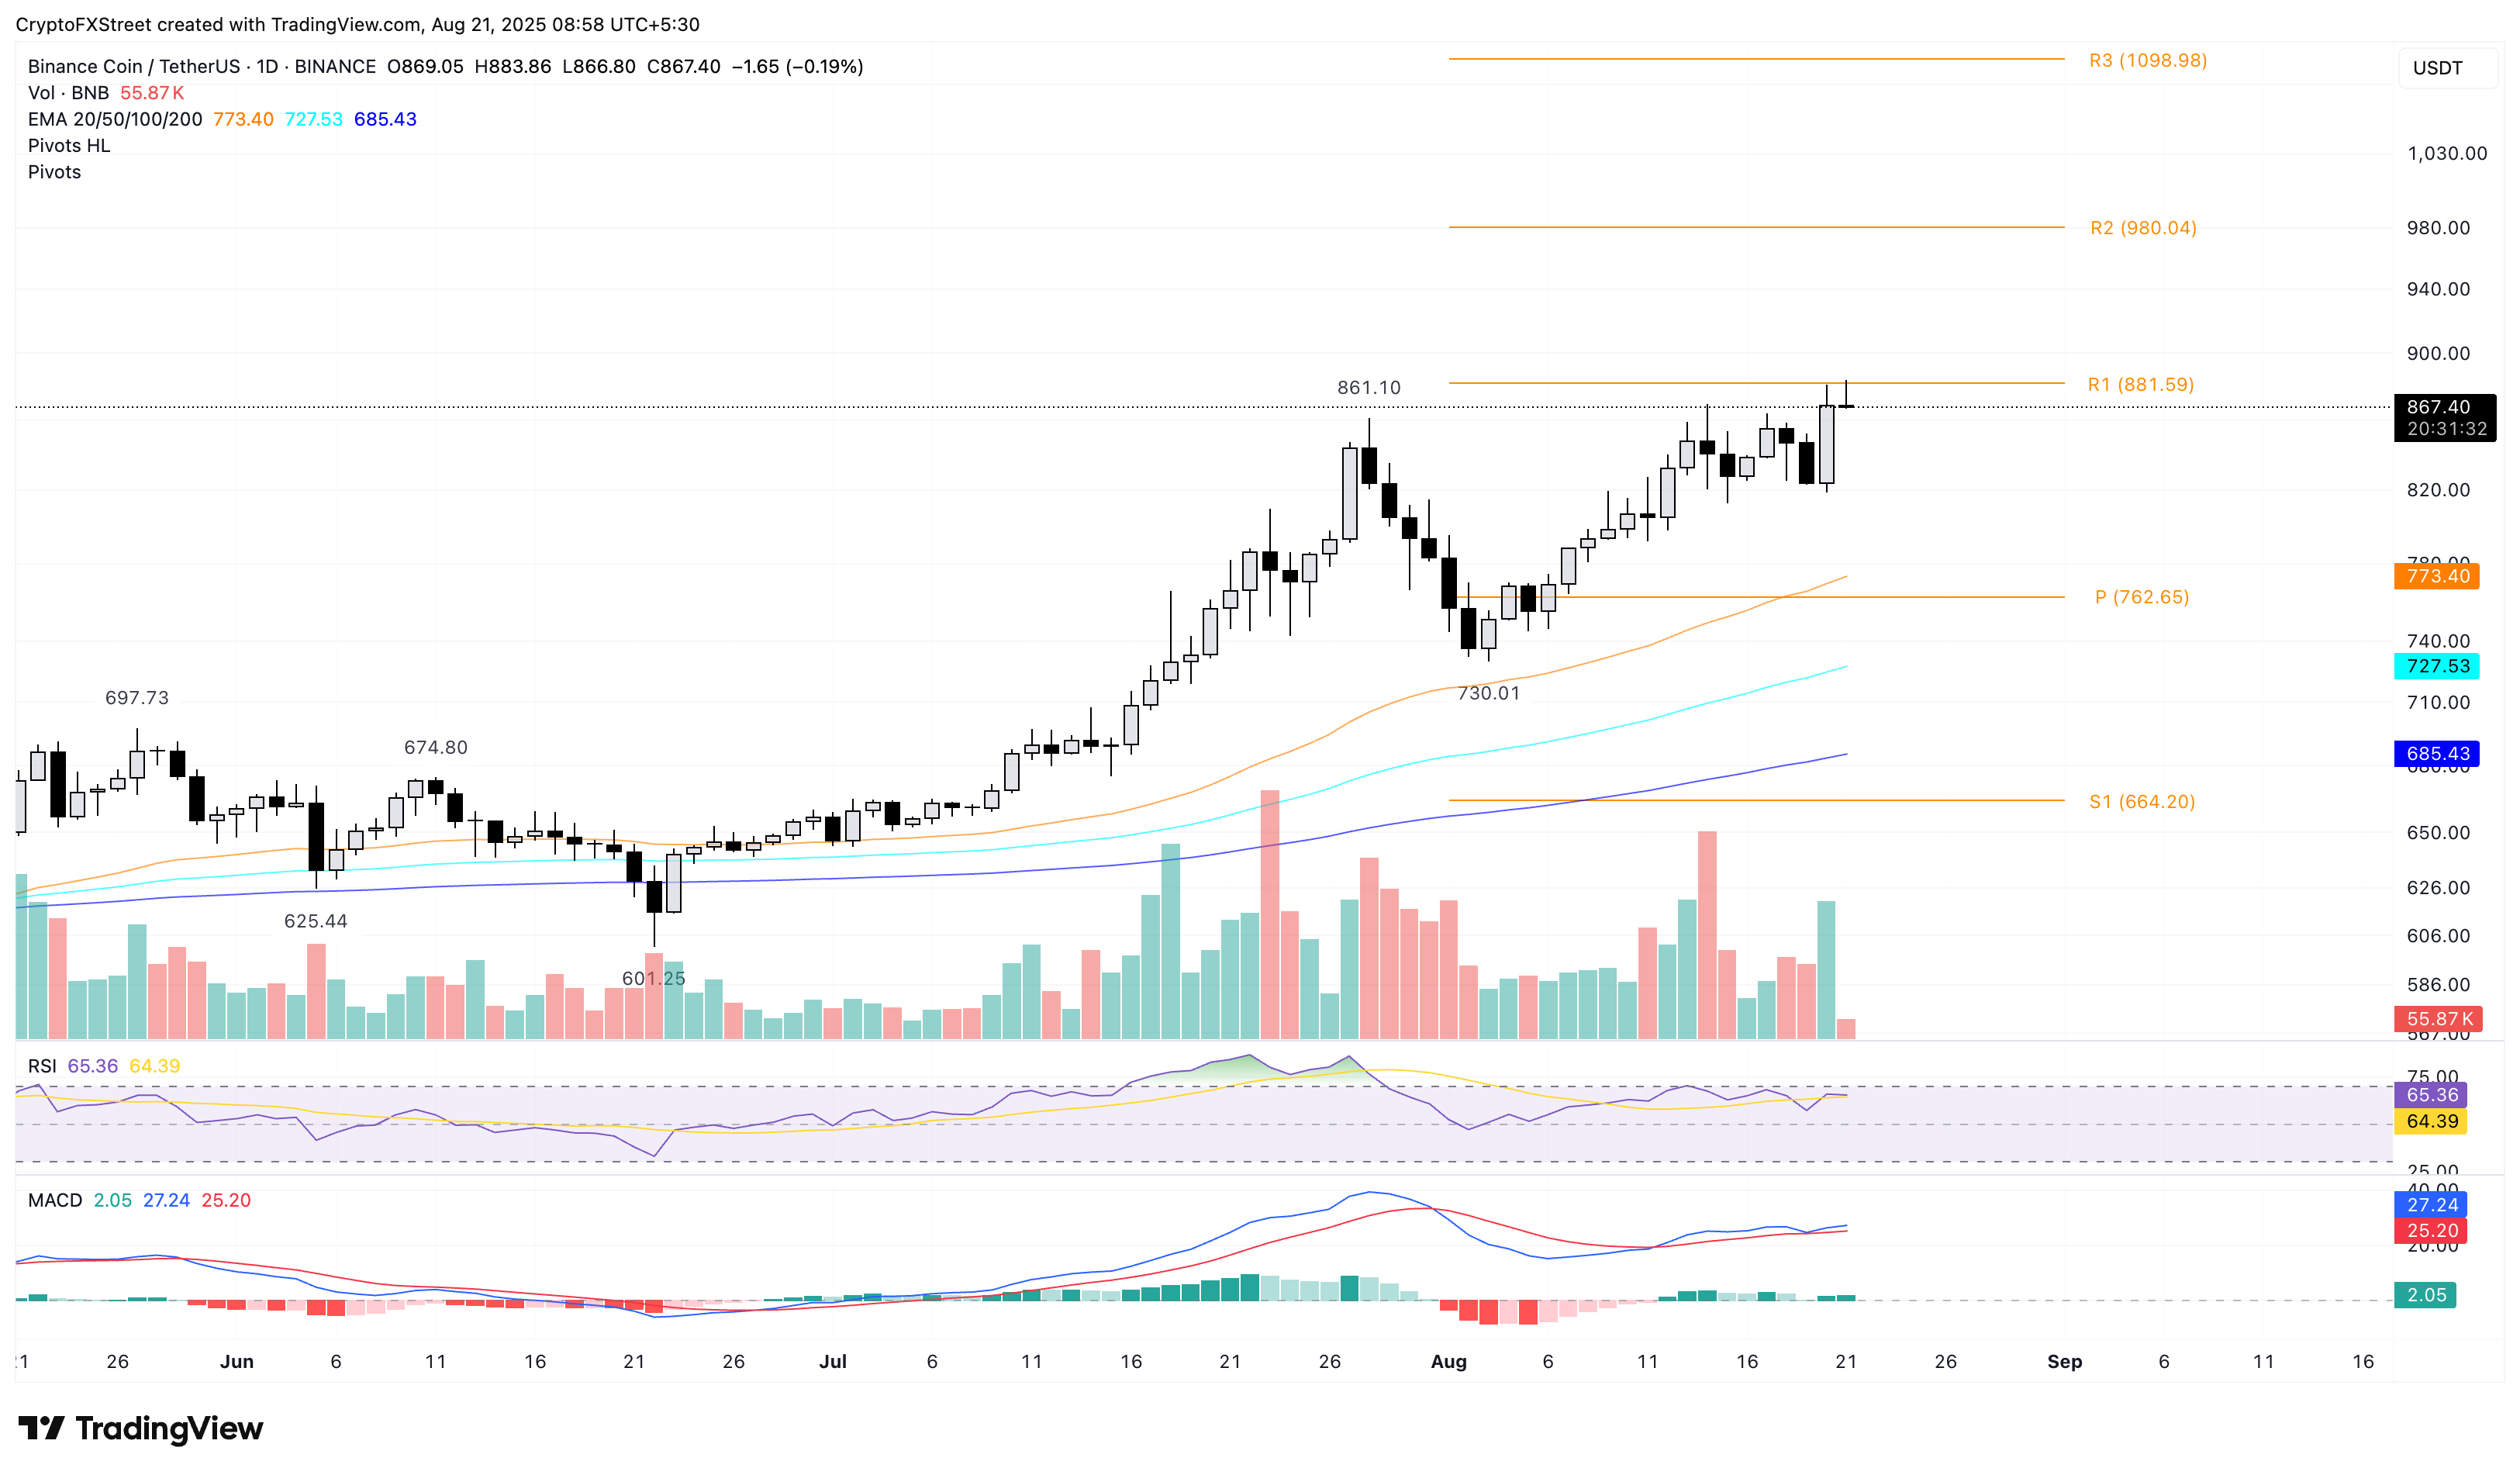
BNB/USDT daily price chart.
On the downside, the 50-day Exponential Moving Average (EMA) at $773 and the centre pivot level at $762 could act as support levels.
Solana nears crucial resistance level
Solana trades at $188 at press time on Thursday, maintaining the 6.65% gains from the previous day. The reversal from above the 50-day EMA eyes the 61.8% Fibonacci level at $191, derived from the retracement between the January 19 peak at $295 and the April 7 low at $95.
A decisive close above this Fibonacci retracement level could extend the uptrend to the $206 resistance level, marked by the July 22 high.
The momentum indicators remain mixed on the daily chart, as the MACD and its signal line converge flat. Meanwhile, the RSI, at 55, is above its halfway line, indicating a minor bullish tilt.
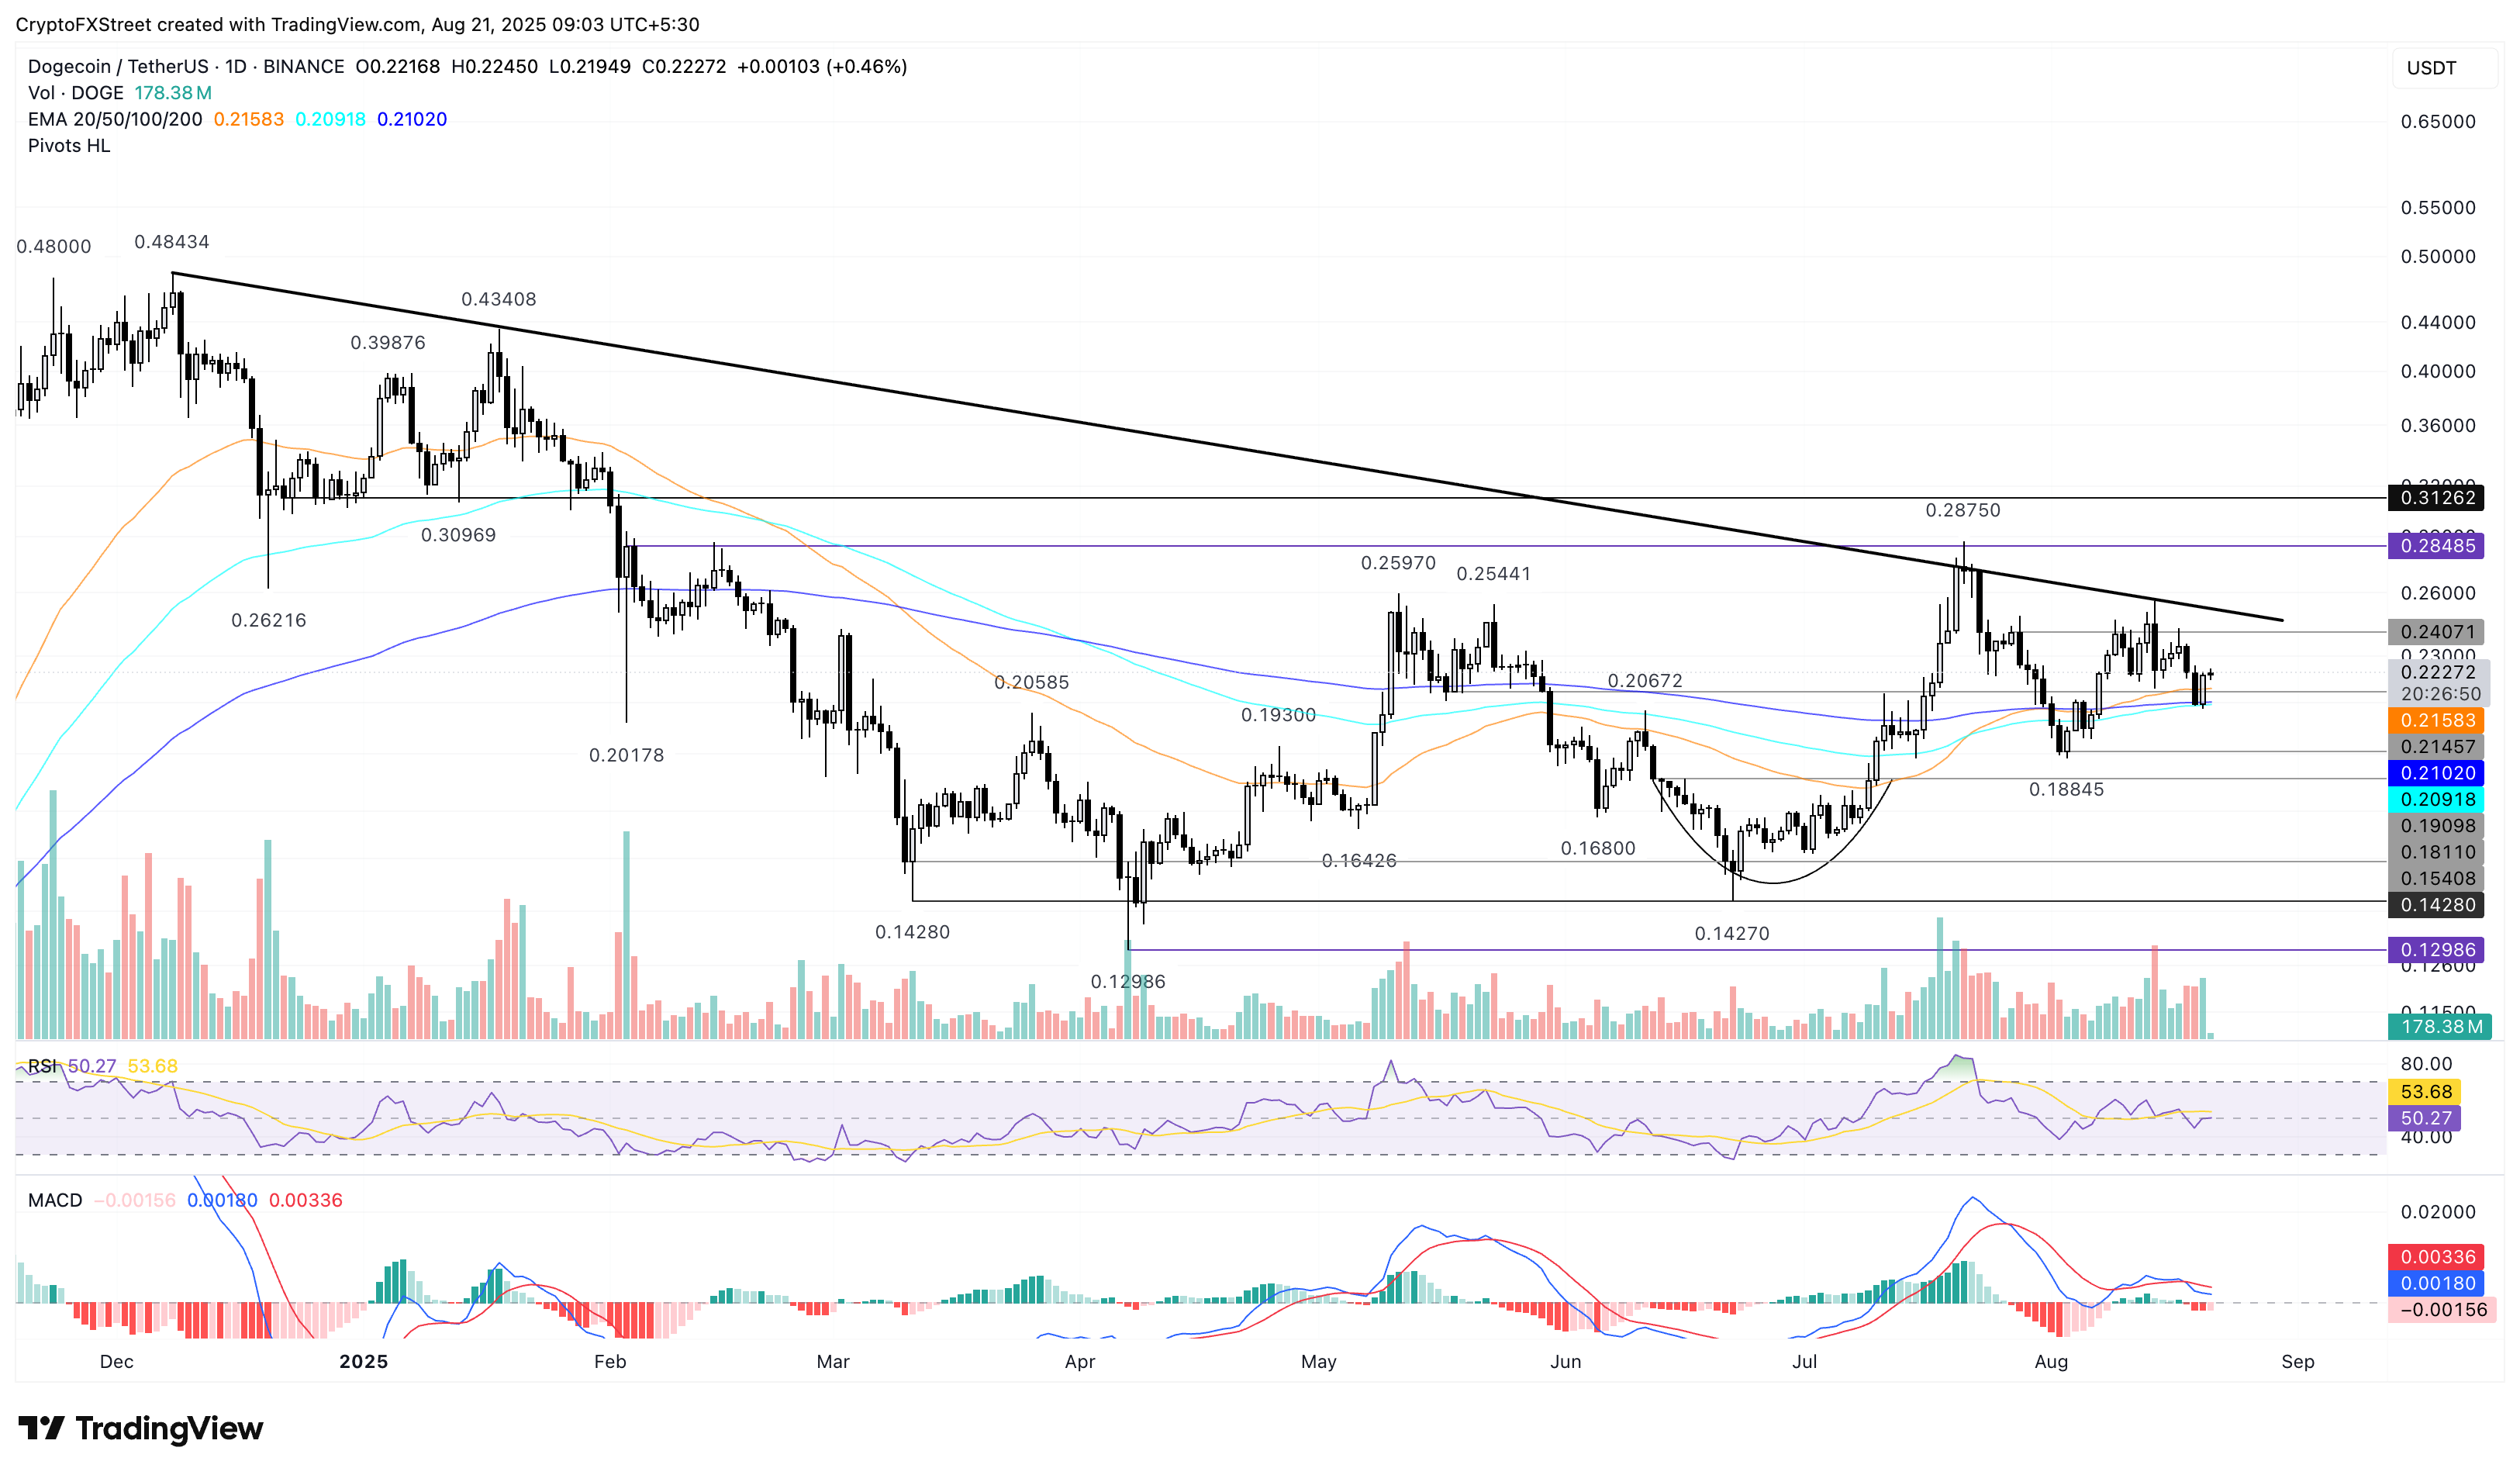
SOL/USDT daily price chart.
On the flip side, a reversal below the 50-day EMA at $175 could test the 50% retracement level at $167.
Dogecoin rebounds amid an impending Golden Cross
Dogecoin, the largest meme coin by market capitalization of $33.54 billion, bounced off 5.85% on Wednesday from the 100-day EMA at $0.2091. At the time of writing, the meme coin trades at $0.2227, representing a nearly 0.50% gain from Thursday.
The reversal run in DOGE targets the $0.2407 resistance, last tested on August 17. A decisive push beyond this level could drive the uptrend to challenge an overhead resistance trendline formed by connecting the December 8 and January 18 peaks. To reinstate a bullish trend, DOGE should surpass the resistance trendline.
The declining MACD and its signal line, as they approach the zero line, indicate a bearish shift in trend momentum. Still, the RSI at 50 moves flat on the same chart, holding at neutral levels.
The 100-day EMA is inching closer to surpassing the 200-day EMA, which would trigger a buy signal as the short-term trend outpaces the longer-term price movement.
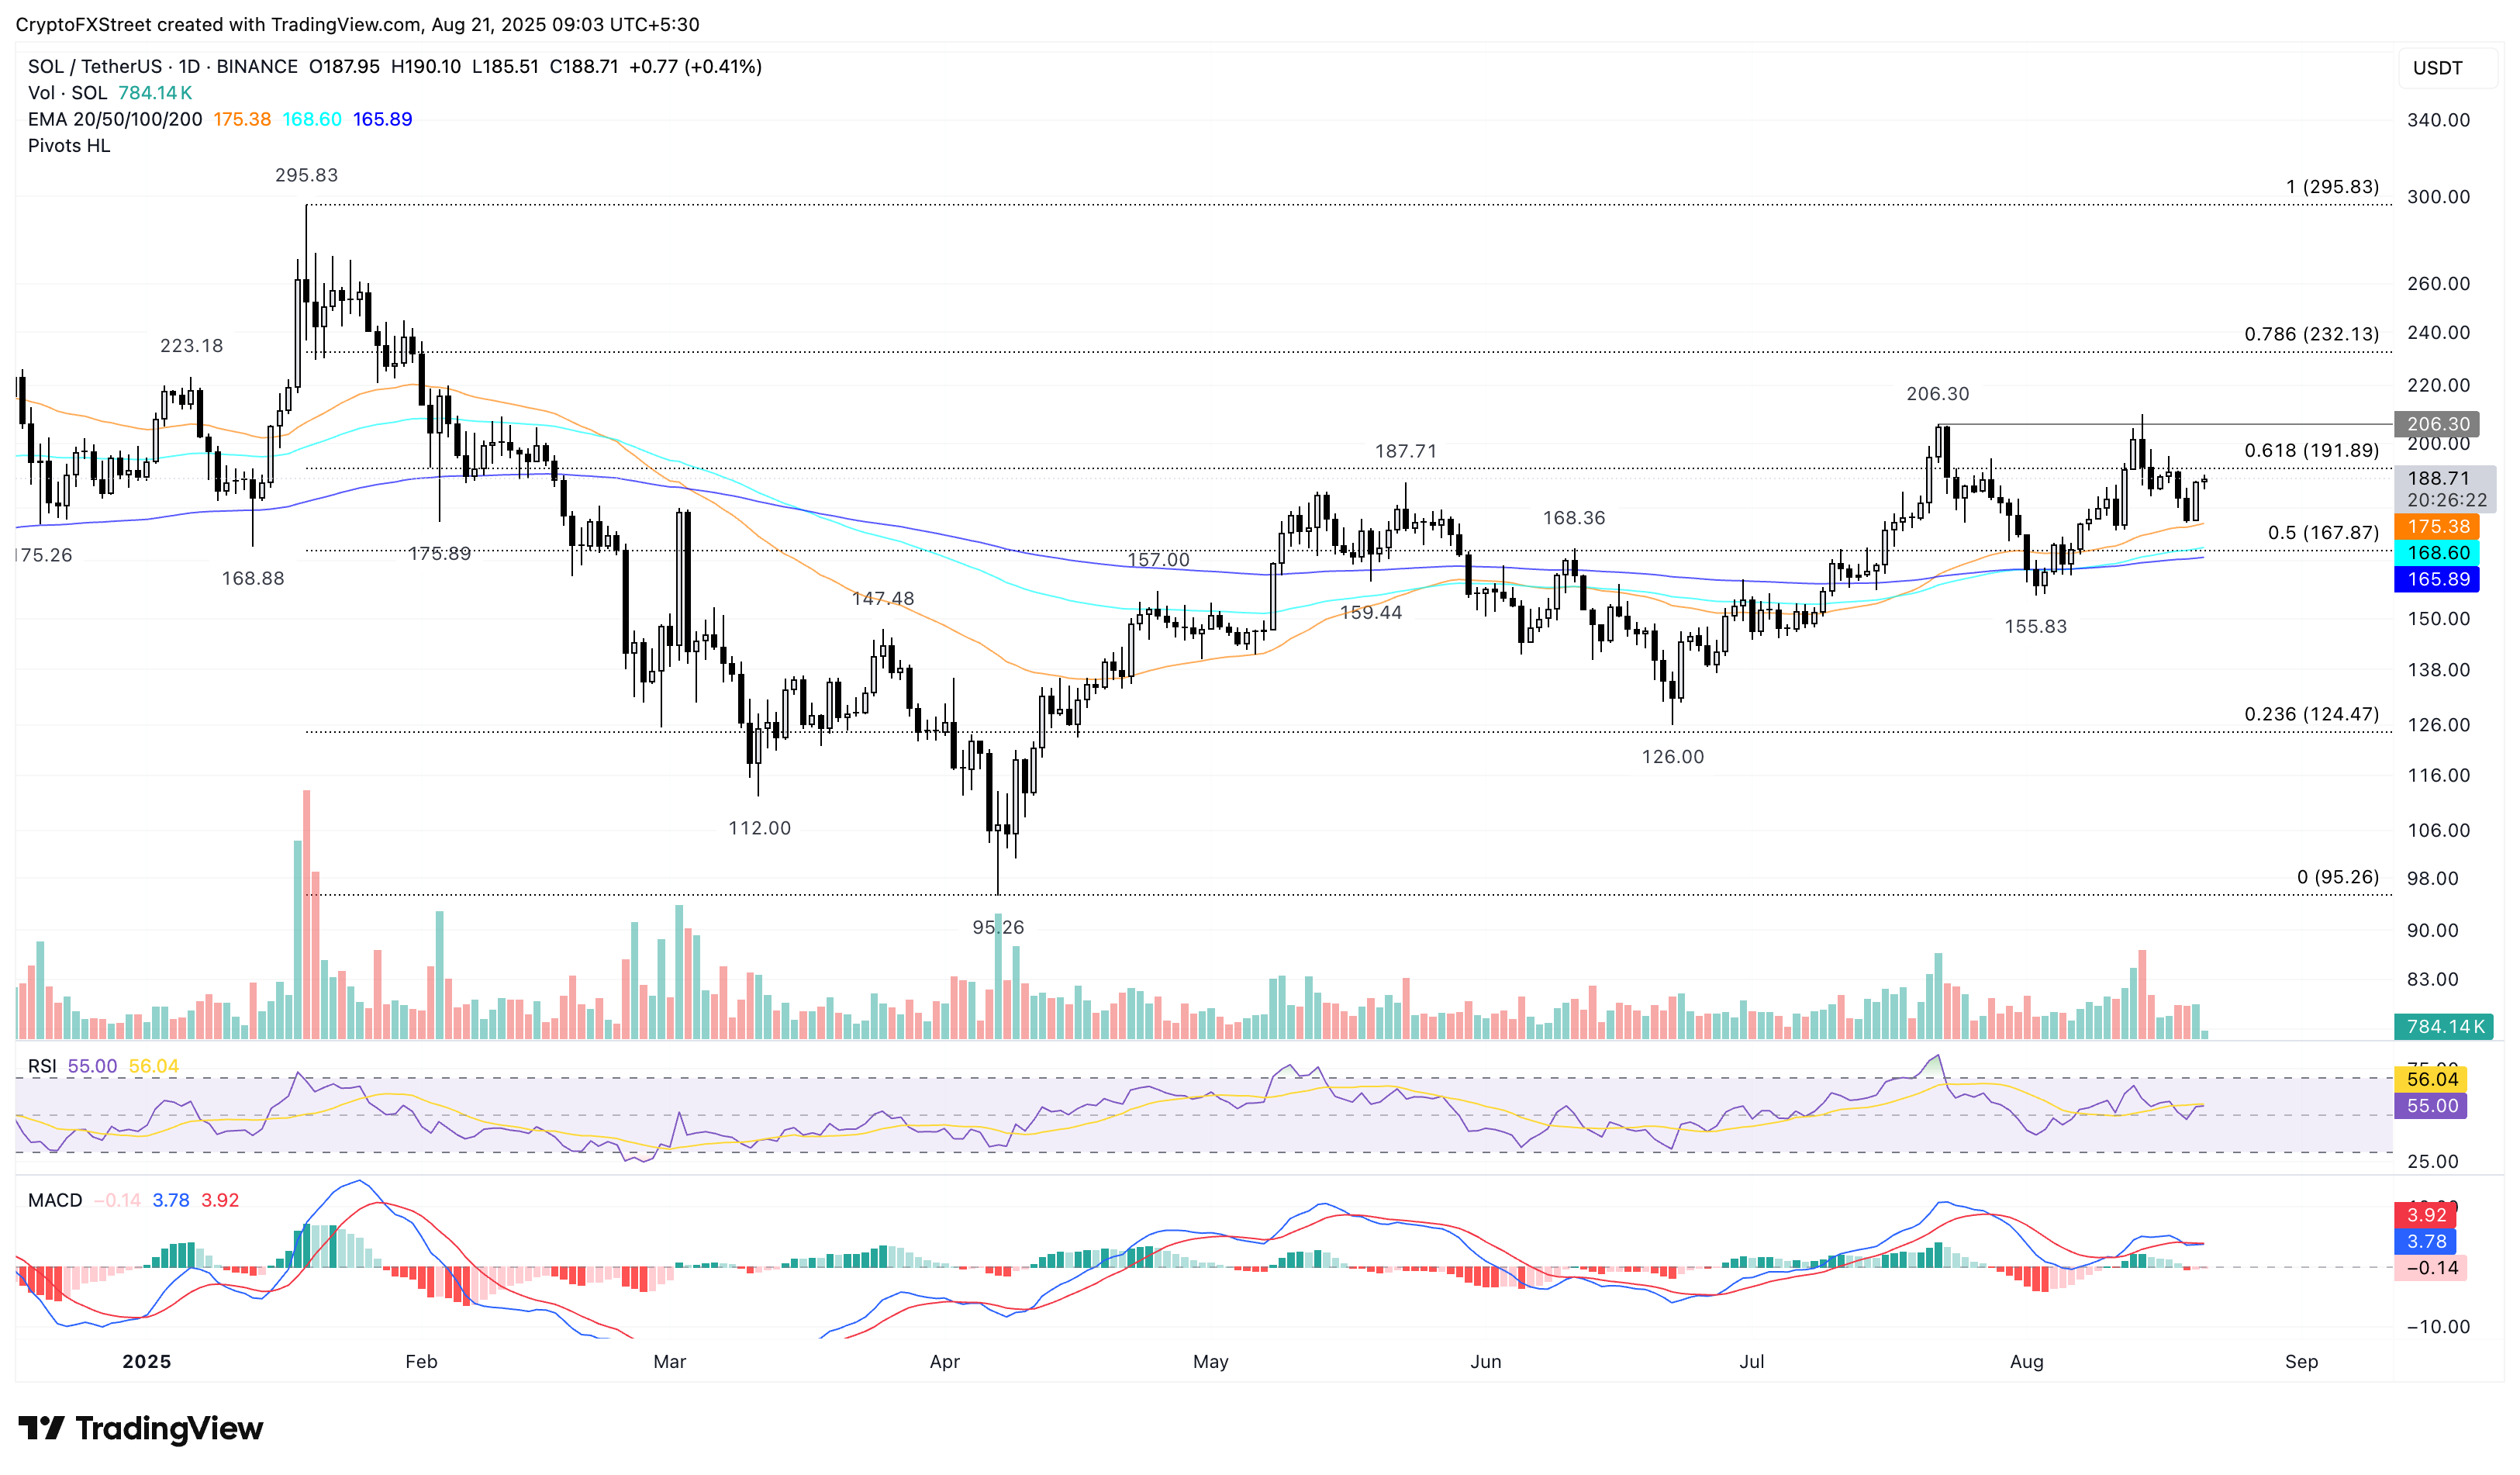
DOGE/USDT daily price chart.
Looking down, if DOGE drops below the 100-day EMA at $0.2091, it could extend the decline to $0.1909 support, marked by the August 2 close.
Author

Vishal Dixit
FXStreet
Vishal Dixit holds a B.Sc. in Chemistry from Wilson College but found his true calling in the world of crypto.