BNB Price Forecast: BNB posts highest weekly close, eyes new all-time high
- BNB price closes at a record weekly high of $756.82, marking a 9.37% gain over the past week.
- Derivatives data show that BNB Open Interest reaches its highest yearly level of $1.05 billion on Monday, signaling growing confidence among investors.
- The technical outlook suggests a continuation of the rally, targeting beyond its all-time high of $793.86.

BNB (BNB), formerly known as Binance Coin, continues to trade higher above $762 at the time of writing on Monday after closing at its highest-ever weekly level and gaining over 9% last week. Derivatives data support a bullish thesis as Open Interest (OI) hits a yearly high of $1.05 billion, reflecting renewed investor interest. The technical analysis also suggests a continuation of the rally, targeting its all-time high of $793.86 and potentially entering a price discovery mode.
Binance Coin’s Open Interest hits a yearly high of $1.05 billion
CoinGlass’ data shows that the futures’ OI in BNB at exchanges rises to a new yearly high of $1.05 billion on Monday from $829.50 million on Wednesday. An increasing OI represents new or additional money entering the market and new buying, which could fuel the current BNB price rally.
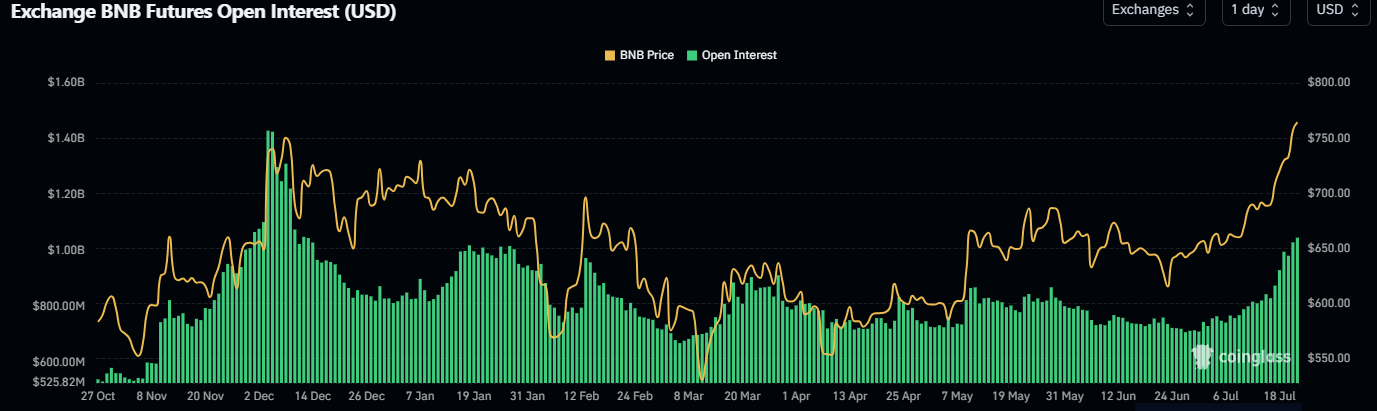
BNB Open Interest chart. Source: CoinGlass
BNB Price Forecast: BNB heads toward its all-time highs
BNB price on the weekly chart has rallied by more than 9% and closed at its highest weekly level to date at $756.82. At the start of this week, on Monday, it continues to trade higher above $760.
If BNB continues its upward trend, it could extend the rally toward its all-time high at $793.86. A successful close above this level could extend the gains toward its 141.40% Fibonacci extension level at $956.92, drawn from the August low of $400 to the all-time high in December at $793.86.
The Relative Strength Index (RSI) on the weekly chart reads 66, surpassing its neutral level of 50, which indicates strong bullish momentum. The Moving Average Convergence Divergence (MACD) indicator on a weekly chart showed a bullish crossover in mid-May. The rising green histogram bars above its neutral zero line suggest that bullish momentum is gaining traction.
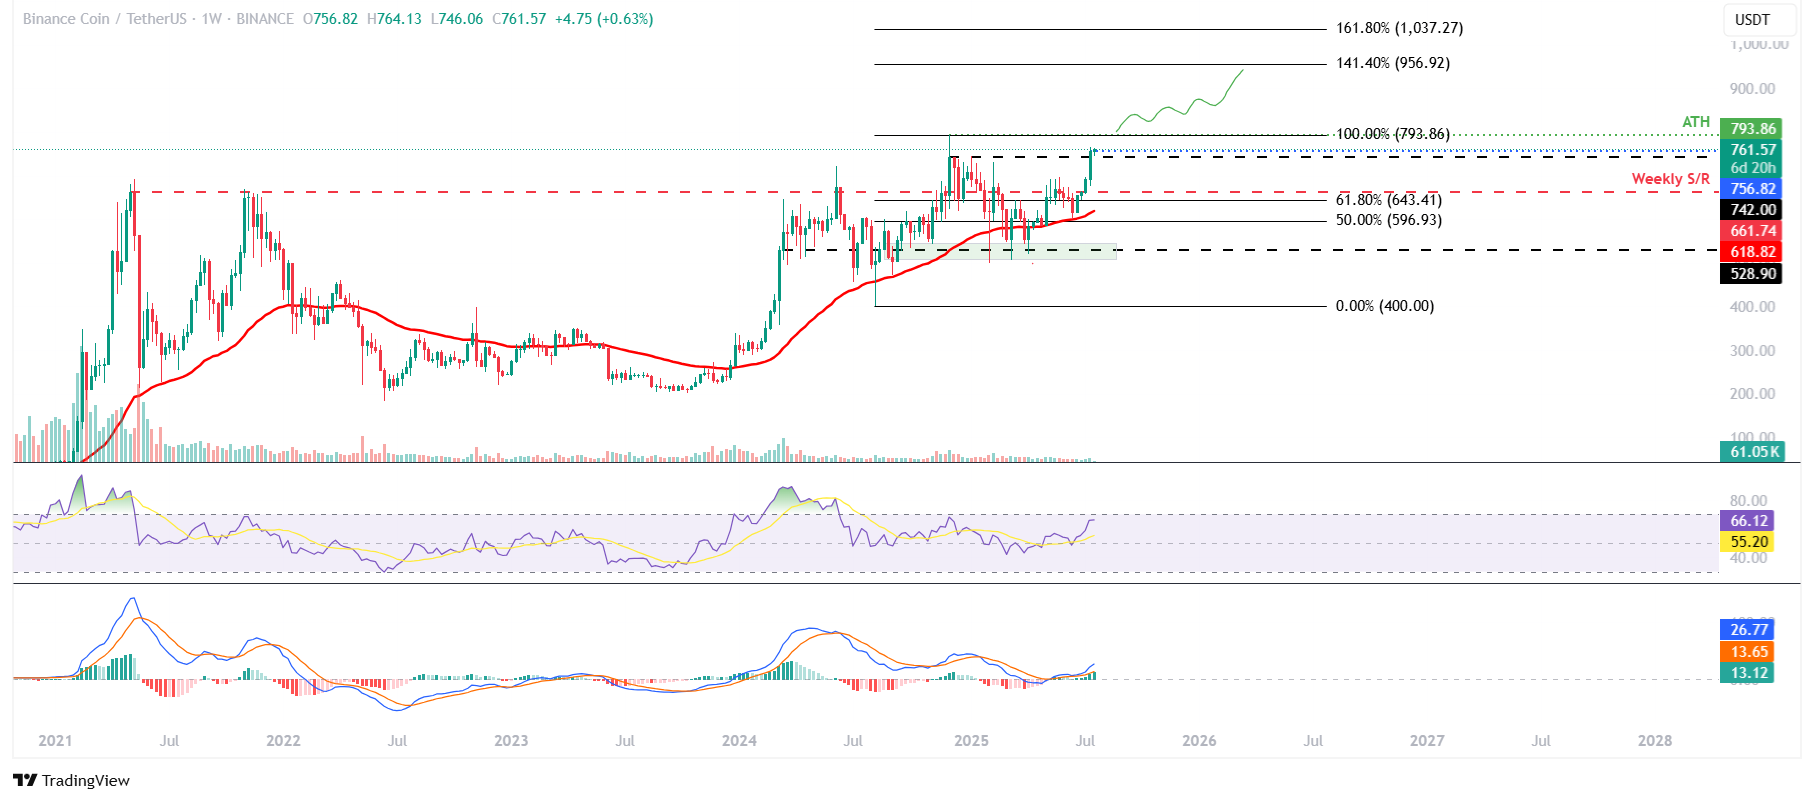
BNB/USDT weekly chart
On the daily chart, BNB broke above the upper trendline of a falling wedge pattern and reached its target at $709.29 on Wednesday. It continued the upward trend, closing above the next weekly resistance at $742 on Sunday. At the time of writing on Monday, it trades at a price higher than $760.
If the weekly level at $742 holds as support, BNB could extend the rally toward its December 4 all-time high of $793.86.
The RSI on the daily chart reads 83, indicating an extreme overbought condition, which traders should be cautious of. The MACD indicator on the daily chart displayed a bullish crossover in early July that still holds. The rising green histogram bars above its neutral zero line suggest that bullish momentum is gaining traction.
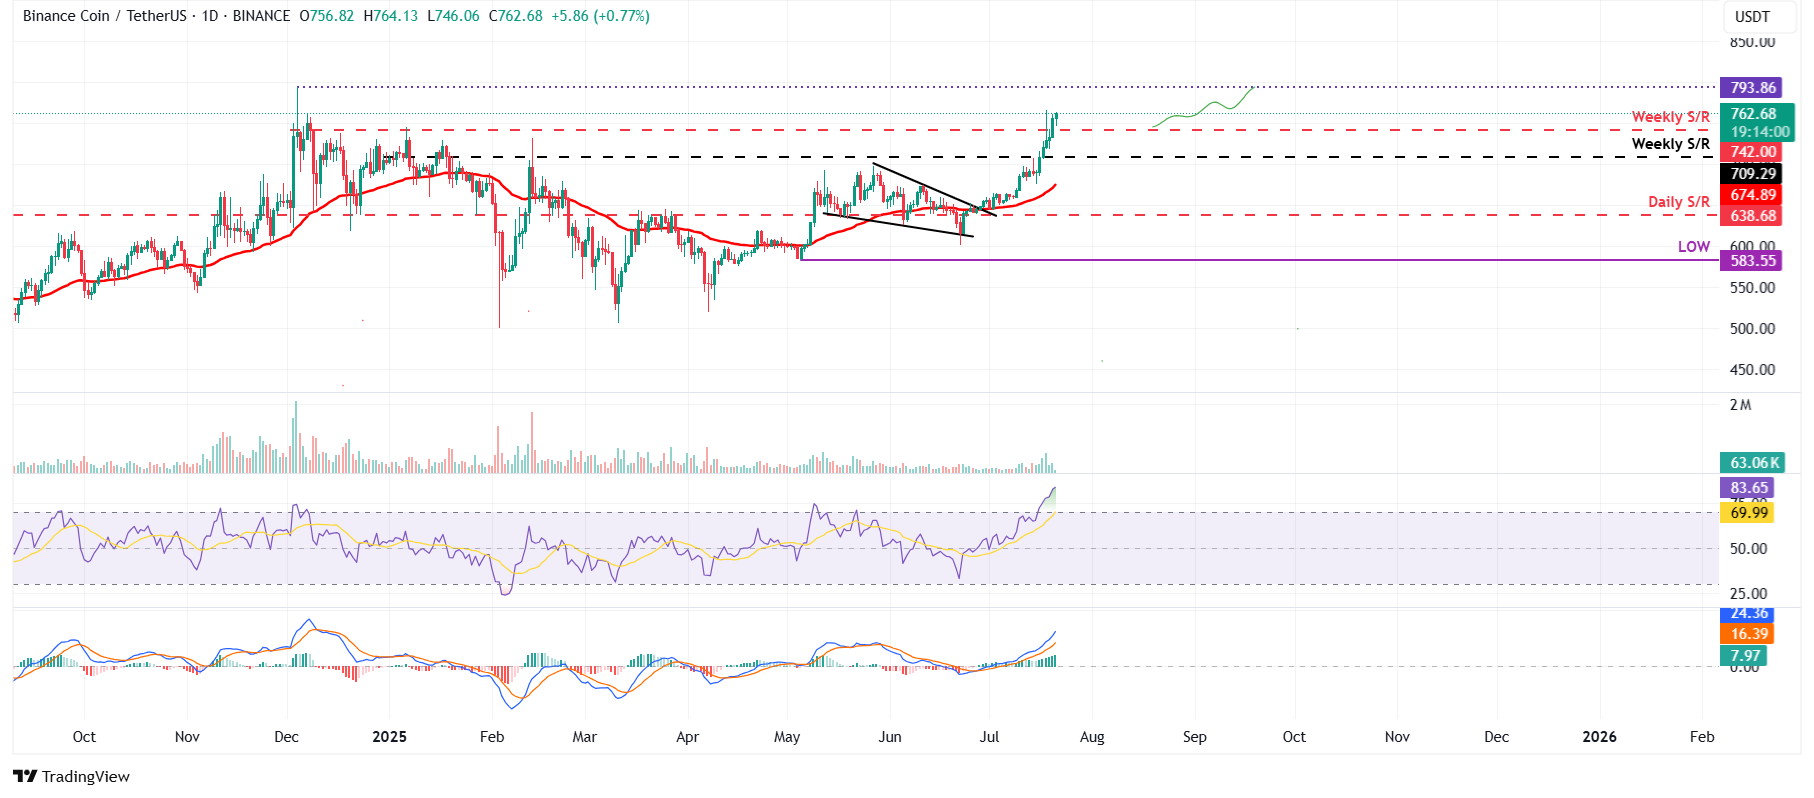
BNB/USDT daily chart
However, if BNB faces a correction, it could extend the decline toward its weekly support at $709.29.
Author

Manish Chhetri
FXStreet
Manish Chhetri is a crypto specialist with over four years of experience in the cryptocurrency industry.


