Top 3 Price Prediction: Bitcoin, Ethereum, Ripple – BTC consolidates while Ethereum and Ripple prepare for breakout
- Bitcoin price has consolidated between $116,000 and $120,000 after reaching a new all-time high of $123,218 last week.
- Ethereum price closes above the daily resistance at $3,730, with bulls targeting the $4,000 mark.
- Ripple’s XRP finds support at a key level at $3.40, hinting at a sign of rally continuation.

Bitcoin (BTC) is taking a breather after reaching a record high of $123,218 last week, consolidating within a tight range as traders await the next move. Meanwhile, Ethereum (ETH) and Ripple (XRP) are showing signs of strength, finding support around their key levels and signaling a potential continuation of the upside.
Bitcoin trades sideways after reaching a new all-time high
Bitcoin price reached a new all-time high of $123,218 on Monday and has been trading sideways between the $116,000 and $120,000 levels. At the time of writing on Monday, it trades slightly above at around $117,800.
If BTC breaks below the lower consolidation boundary at $116,000 on a daily basis, it could extend the decline to retest its 50-day Exponential Moving Average (EMA) at $110,297.
The Relative Strength Index (RSI) on the daily chart reads 64 after falling from its overbought level of 70 last week, indicating fading bullish momentum. The Moving Average Convergence Divergence (MACD) indicator is about to flip a bearish crossover on the daily chart. If it shows a bearish crossover on a daily basis, it gives a selling signal and indicates a bearish momentum.
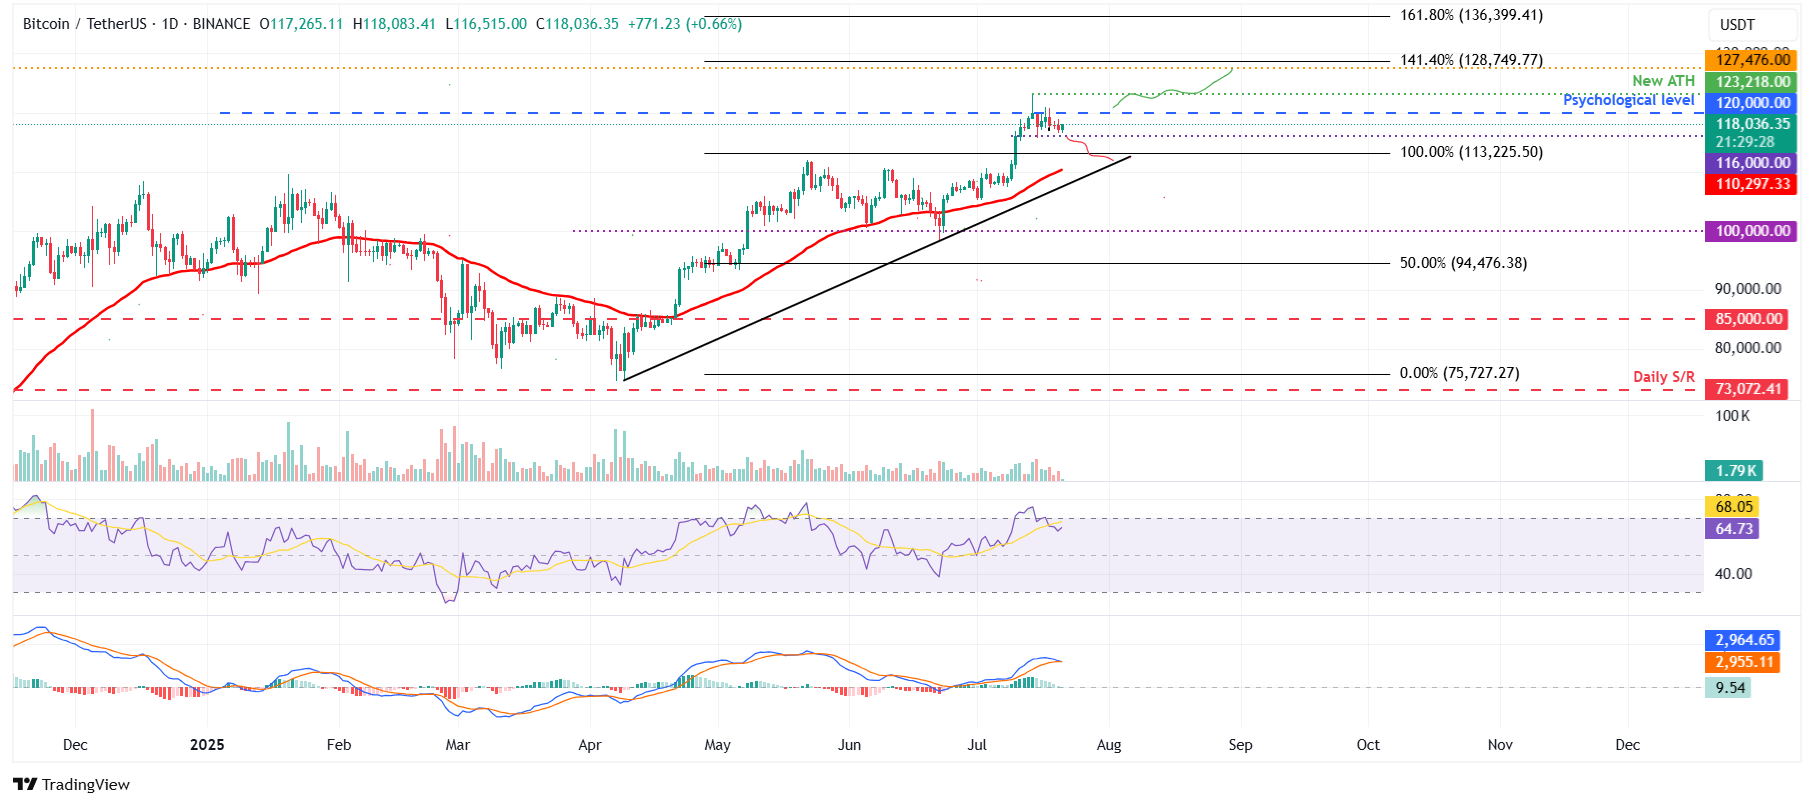
BTC/USDT daily chart
However, if BTC closes above the upper boundary of consolidation at $120,000 on a daily basis, it could extend the recovery toward the fresh all-time high at $123,218 and beyond.
Ethereum bulls aiming for $4,000 mark
Ethereum price rose 26.40% last week and closed above the daily resistance at $3,730 on Sunday. At the time of writing on Monday, it hovers at around $3,739.
If ETH continues its upward trend and the daily level at $3,730 holds as support, it could extend the rally toward its next key psychological level at $4,000.
The RSI on the daily chart reads 86, which is above its overbought level of 70, indicating strong bullish momentum. Meanwhile, the MACD indicator displayed a bullish crossover in early July that still holds. The rising green histogram bars above its neutral zero line suggest that bullish momentum is gaining traction.
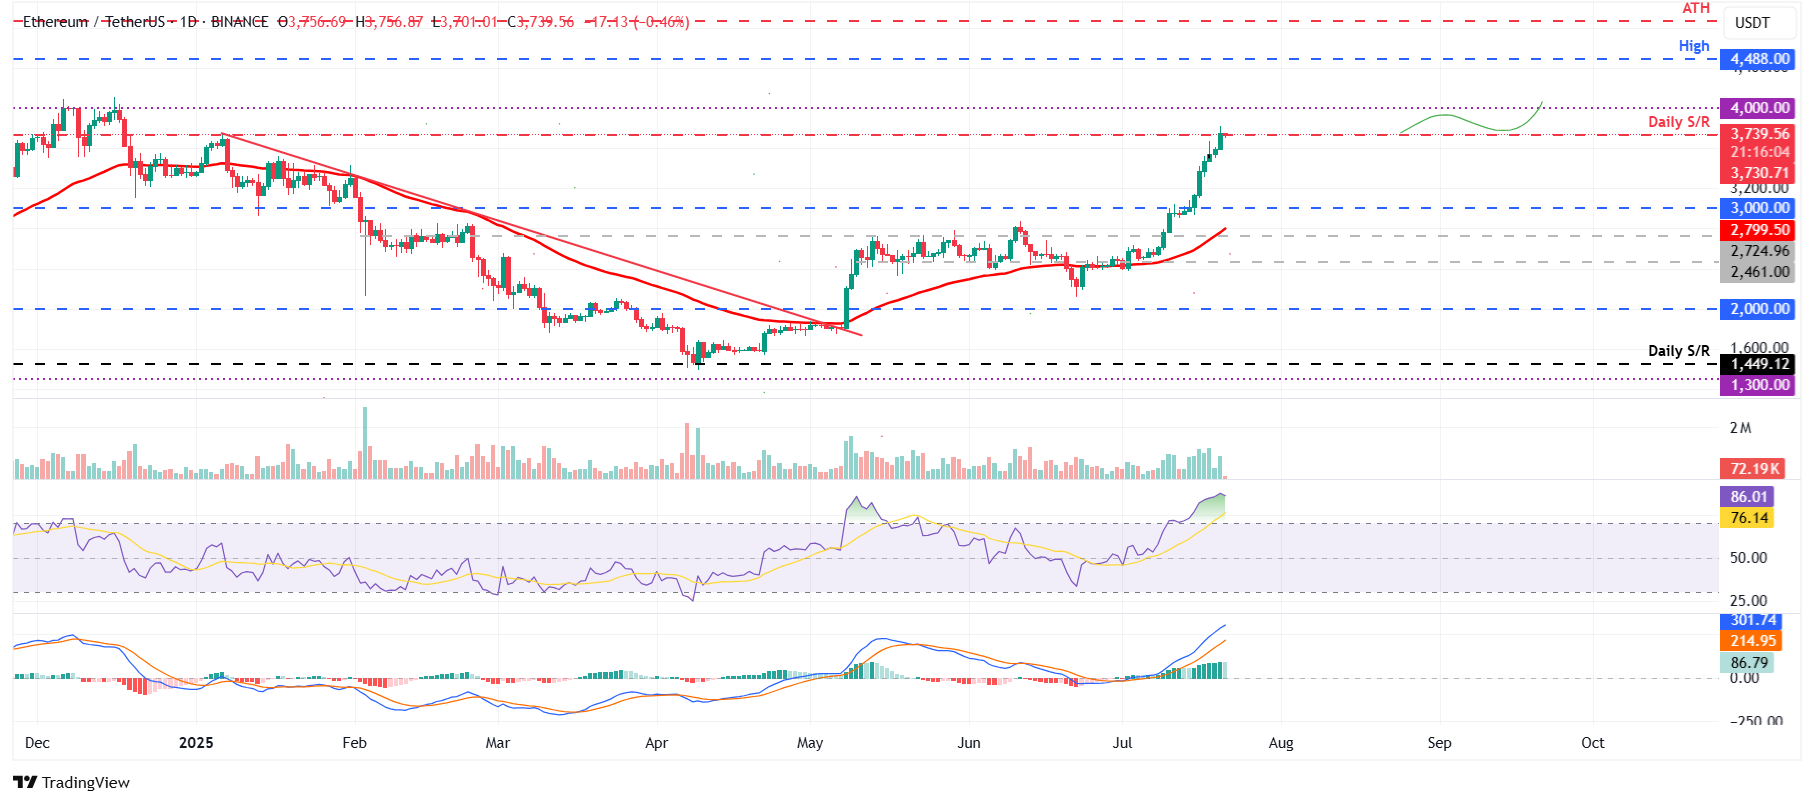
ETH/USDT daily chart
However, if ETH faces a pullback, it could extend the decline to find support around its key level at $3,000.
XRP finds support around its key level at $3.40
XRP price rallied by more than 20% last week, reaching a new all-time high of $3.66 on Friday. At the time of writing on Monday, it trades slightly higher at $3.47, having found support around the daily level of $ 3.40 during the weekend.
If XRP continues its upward trend, it could extend the rally toward the record level at $3.66. A successful close above this level will extend the rally toward its 141.40% Fibonacci extension level at $4.13, drawn from the January high of $3.40 to the April low of $1.61.
However, the RSI indicator on the daily chart reads 84, indicating an extreme overbought condition, which traders should be cautious of. Meanwhile, like Ethereum, the MACD indicator suggests further gains for XRP ahead.
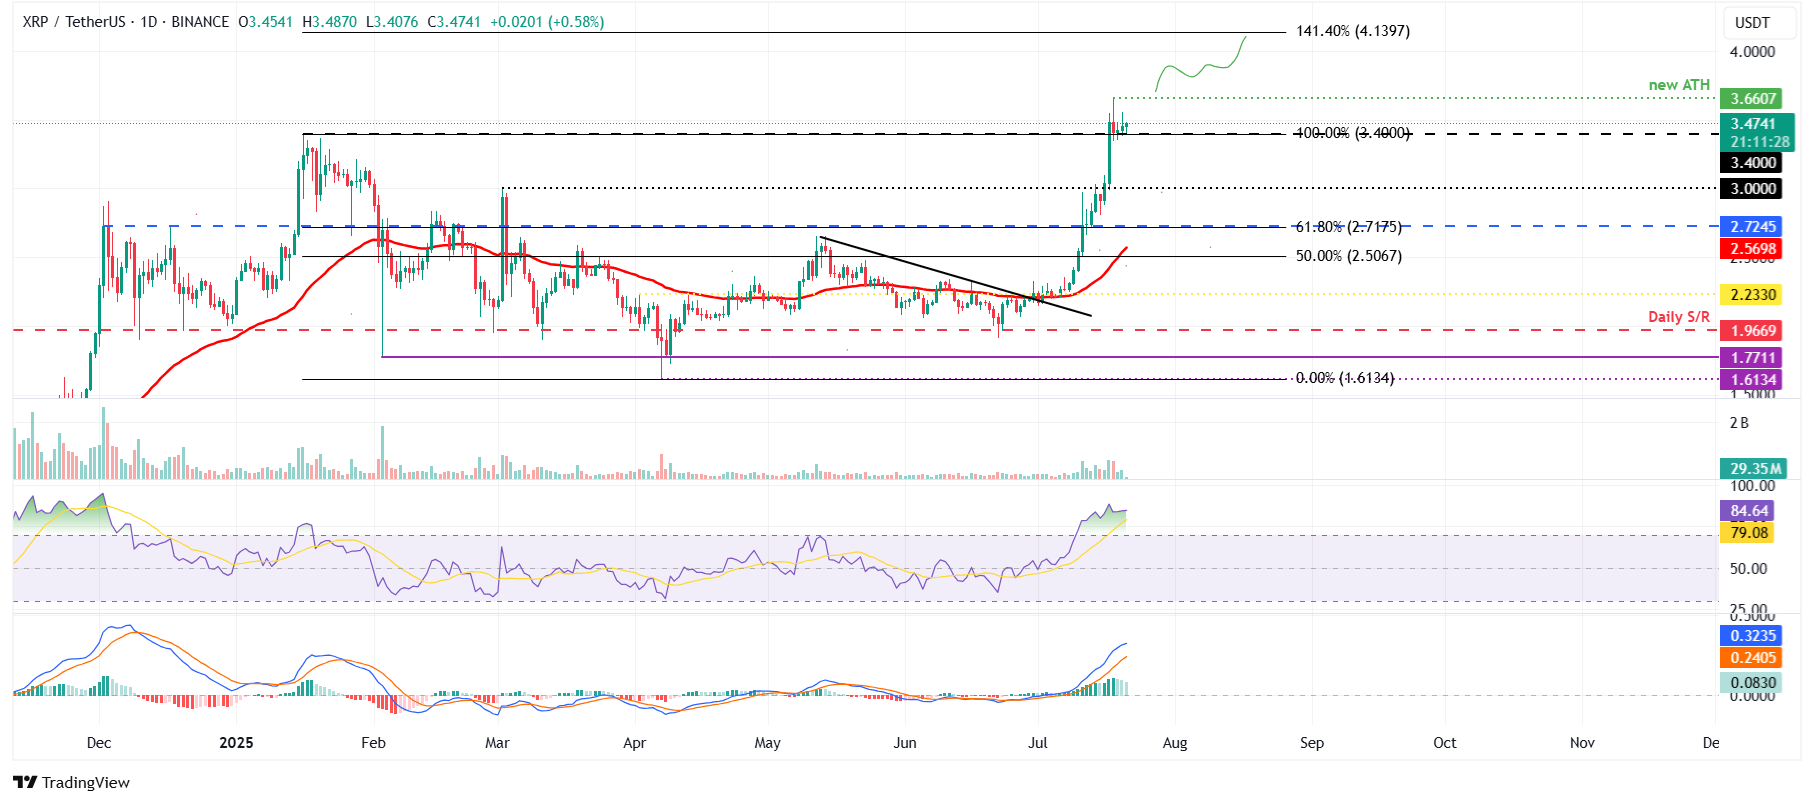
XRP/USDT daily chart
On the other hand, if XRP faces a correction, it could extend the decline to find support around its daily level at $3.40.
Cryptocurrency metrics FAQs
The developer or creator of each cryptocurrency decides on the total number of tokens that can be minted or issued. Only a certain number of these assets can be minted by mining, staking or other mechanisms. This is defined by the algorithm of the underlying blockchain technology. On the other hand, circulating supply can also be decreased via actions such as burning tokens, or mistakenly sending assets to addresses of other incompatible blockchains.
Market capitalization is the result of multiplying the circulating supply of a certain asset by the asset’s current market value.
Trading volume refers to the total number of tokens for a specific asset that has been transacted or exchanged between buyers and sellers within set trading hours, for example, 24 hours. It is used to gauge market sentiment, this metric combines all volumes on centralized exchanges and decentralized exchanges. Increasing trading volume often denotes the demand for a certain asset as more people are buying and selling the cryptocurrency.
Funding rates are a concept designed to encourage traders to take positions and ensure perpetual contract prices match spot markets. It defines a mechanism by exchanges to ensure that future prices and index prices periodic payments regularly converge. When the funding rate is positive, the price of the perpetual contract is higher than the mark price. This means traders who are bullish and have opened long positions pay traders who are in short positions. On the other hand, a negative funding rate means perpetual prices are below the mark price, and hence traders with short positions pay traders who have opened long positions.
Author

Manish Chhetri
FXStreet
Manish Chhetri is a crypto specialist with over four years of experience in the cryptocurrency industry.


