Bittensor Price Forecast: TAO offers multiple bullish signals as AI tokens post 17% in weekly gains
- Bittensor is retesting critical $430 resistance after a 50% surge from June lows.
- AI tokens rally alongside other altcoins, growing 17% in a week to reach a market capitalization of $33 billion.
- A Golden Cross pattern, MACD buy signal and an upward trending RSI indicate bullish momentum in TAO.

Bittensor (TAO) holds above $430 on Monday after extending its recovery by 50% from June lows of around $287. The token backing the open-source protocol for machine learning models shows signs of steadying recovery toward $500 in upcoming sessions, especially if the derivatives market holds steady.
Bittensor flaunts bullish outlook
The Bittensor derivatives market has steadily grown with Open Interest (OI) surging to $318 million, marking a significant step above December peak levels of $304 million, according to CoinGlass data.
Open Interest refers to the total value of all the futures and options contracts that have not been settled or closed. With the volume increasing in tandem to $630 million, interest in Bittensor could keep the price elevated as traders increasingly bet on TAO price edging higher. This is evidenced by a positive long-to-short ratio of 1.5988 on Binance.
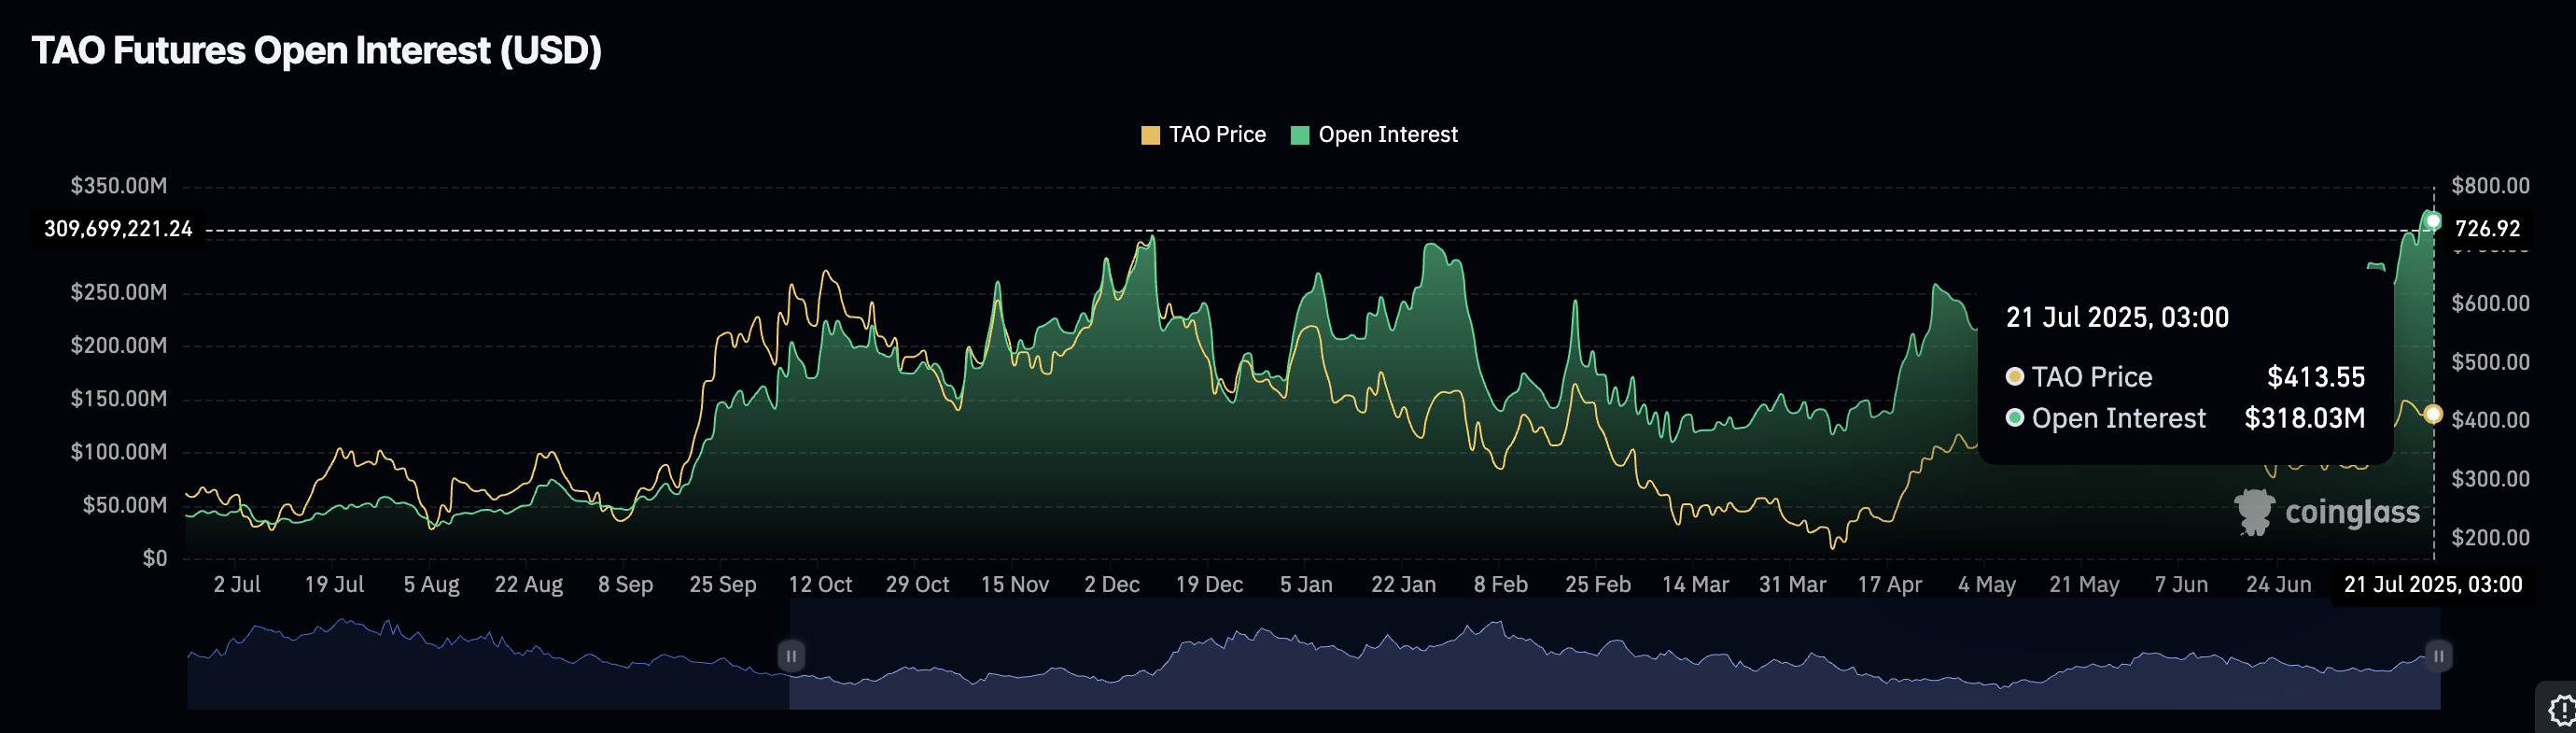
Bittensor Futures Open Interest | Source: CoinGlass
Bittensor is the largest Artificial Intelligence (AI) token, with a market capitalization of $4.4 billion. Interest in AI tokens has been steady, reflected by a cumulative 17% increase over the past week. In total, the sector boasts a market capitalization of $33 billion.
Technical outlook: Bittensor upholds bullish structure
Bittensor’s price holds above a recently broken descending trendline while trading at $430 at the time of writing. The uptrend that followed the June lows of $287 is supported by a Golden Cross pattern established on Friday, when the 50-day Exponential Moving Average (EMA) crossed above the 100-day EMA.
The day’s close could confirm a second Golden Cross pattern if the 50-day EMA remains above the 200-day EMA, reinforcing the bullish structure.
Interest in the AI token could remain at elevated levels should the Moving Average Convergence Divergence (MACD) indicator continue to sustain a buy signal triggered on July 9.
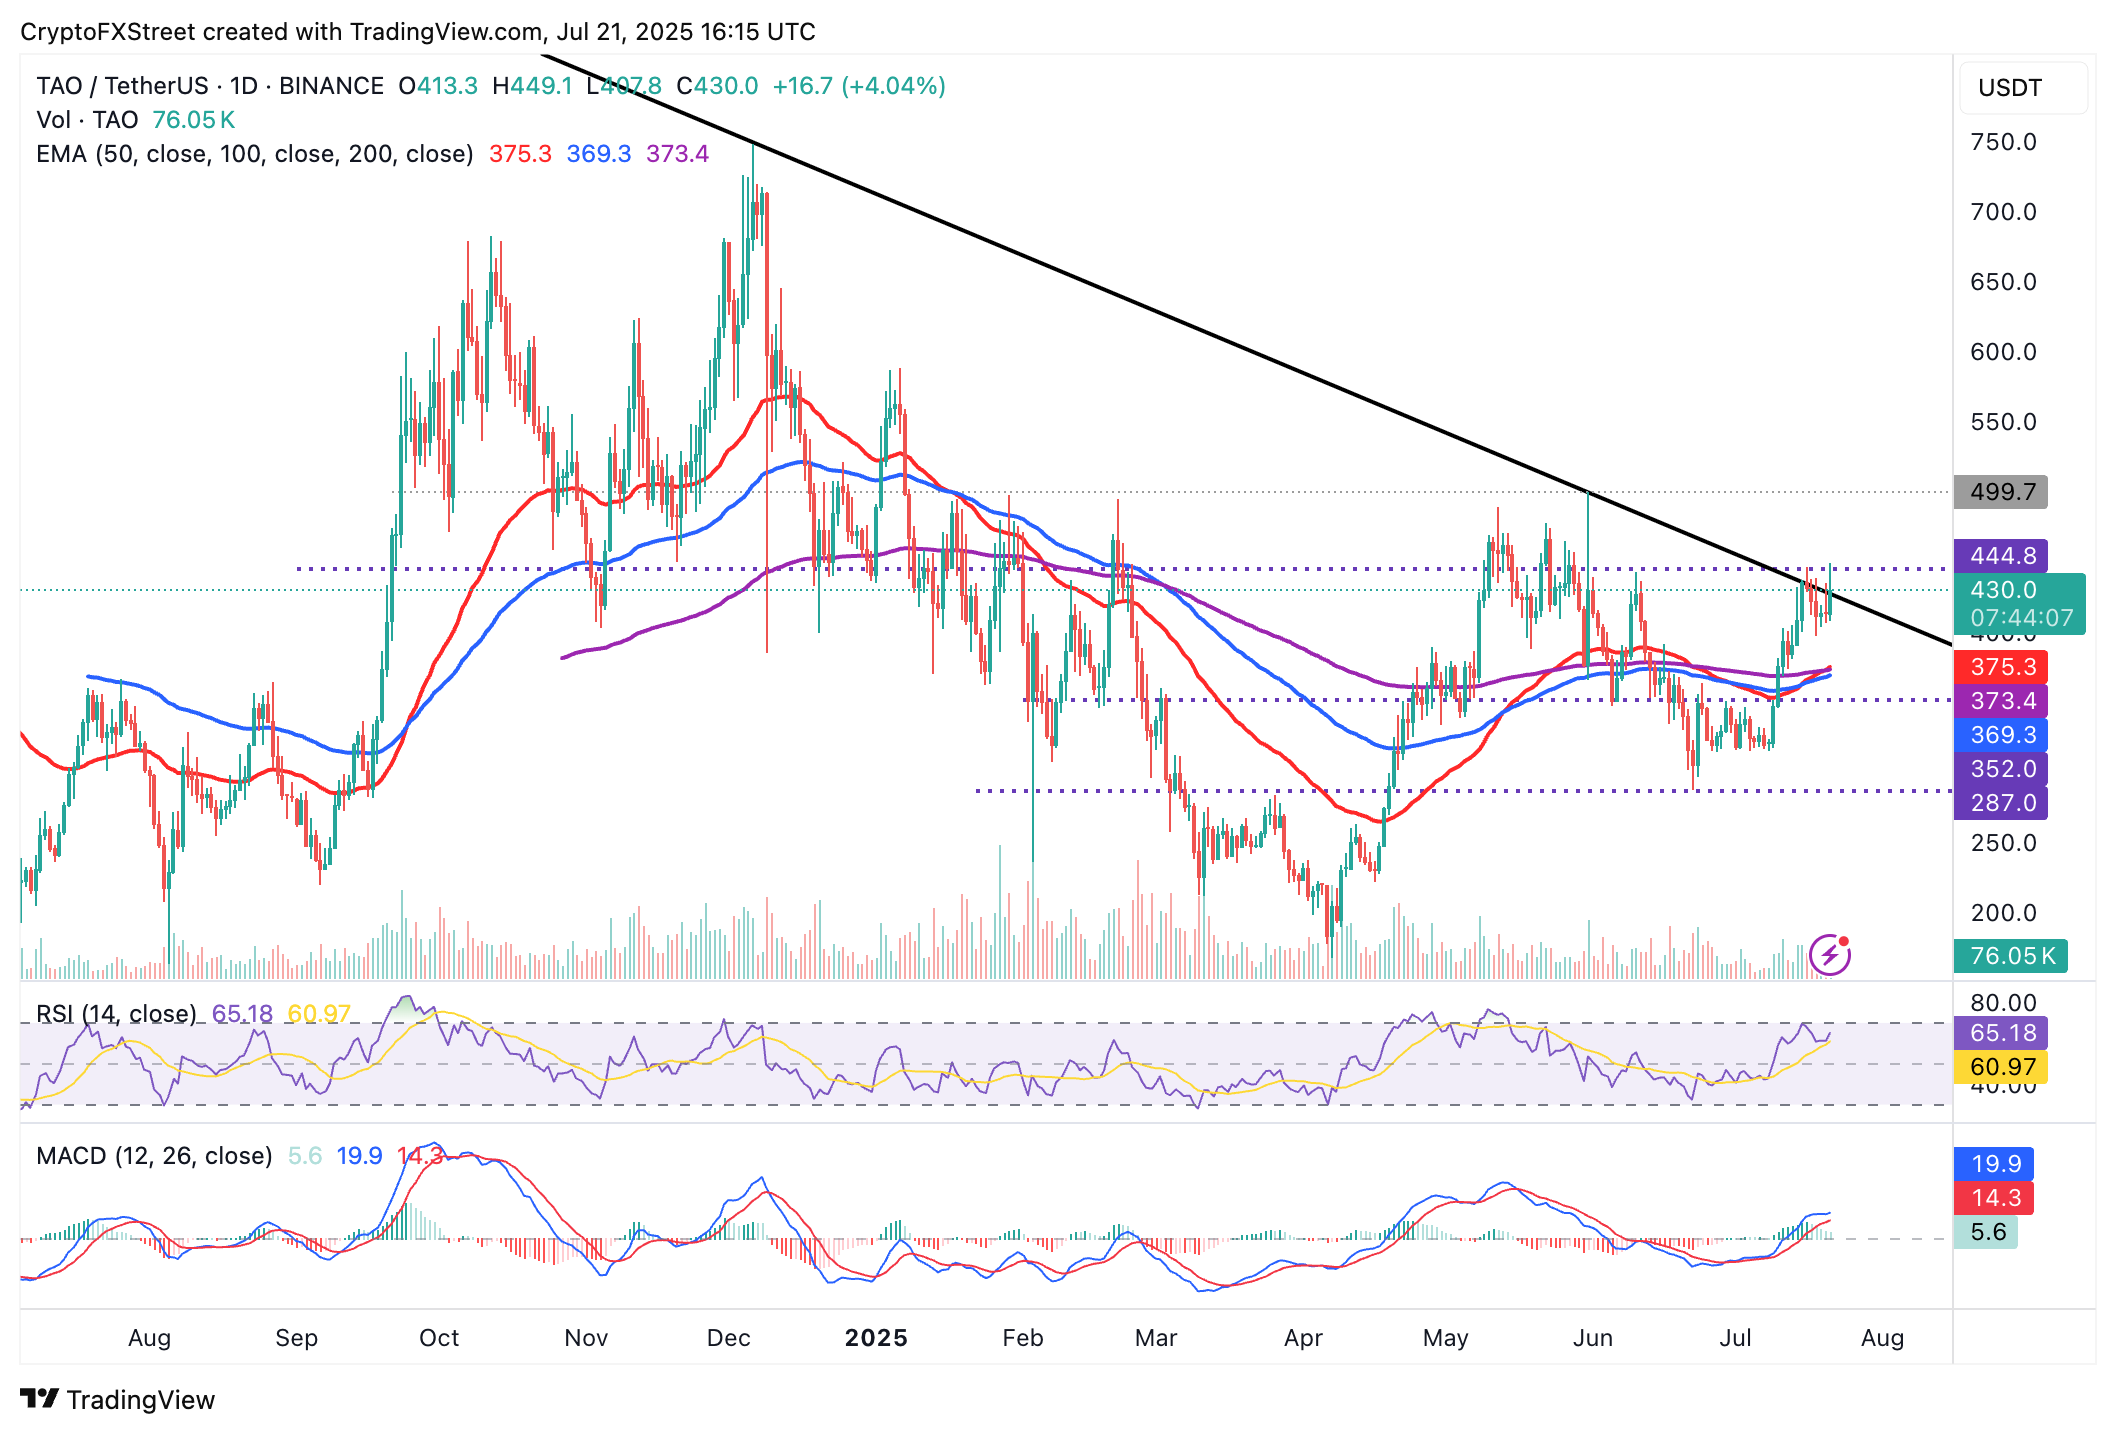
TAO/USDT daily chart
The Relative Strength Index (RSI) is at 64 points, indicating bullish momentum is building behind Bittensor, with the uptrend likely to hold steady in upcoming sessions. Still, higher RSI readings would call for caution among traders as they indicate an overheating market ahead of a potential pullback.
A trend reversal could also occur due to heightened profit-taking activities as well as the possibility of market dynamics changing, particularly with the United States (US) Federal Reserve (Fed) interest rate meeting next week and the implementation of President Donald Trump’s higher tariffs on August 1.
Key areas of interest to traders include support provided by the moving averages, such as the 50-day EMA at $375, the 200-day EMA at $373, and the 100-day EMA at $369.
Open Interest, funding rate FAQs
Higher Open Interest is associated with higher liquidity and new capital inflow to the market. This is considered the equivalent of increase in efficiency and the ongoing trend continues. When Open Interest decreases, it is considered a sign of liquidation in the market, investors are leaving and the overall demand for an asset is on a decline, fueling a bearish sentiment among investors.
Funding fees bridge the difference between spot prices and prices of futures contracts of an asset by increasing liquidation risks faced by traders. A consistently high and positive funding rate implies there is a bullish sentiment among market participants and there is an expectation of a price hike. A consistently negative funding rate for an asset implies a bearish sentiment, indicating that traders expect the cryptocurrency’s price to fall and a bearish trend reversal is likely to occur.
Author

John Isige
FXStreet
John Isige is a seasoned cryptocurrency journalist and markets analyst committed to delivering high-quality, actionable insights tailored to traders, investors, and crypto enthusiasts. He enjoys deep dives into emerging Web3 tren


