Bitcoin’s holy dip: From 90K to 98K – What a move

Bitcoin’s recent price action mirrors the symbolism of India’s Mahakumbh 2025 festival, where devotees take a holy dip in the sacred Ganges, an event that occurs after several years. Similarly, Bitcoin took its own “holy dip” below 90K, only to rebound with renewed strength, reaching highs near 98K, perfectly in line with our previous analysis.
In our last idea, "Bitcoin's brutal blunder or bounce – 90 to 98K what next?", we anticipated this sharp bounce from the 90K level to target 98K, and it played out just as expected.
What happened since the last update
-
The holy dip and rebound:
-
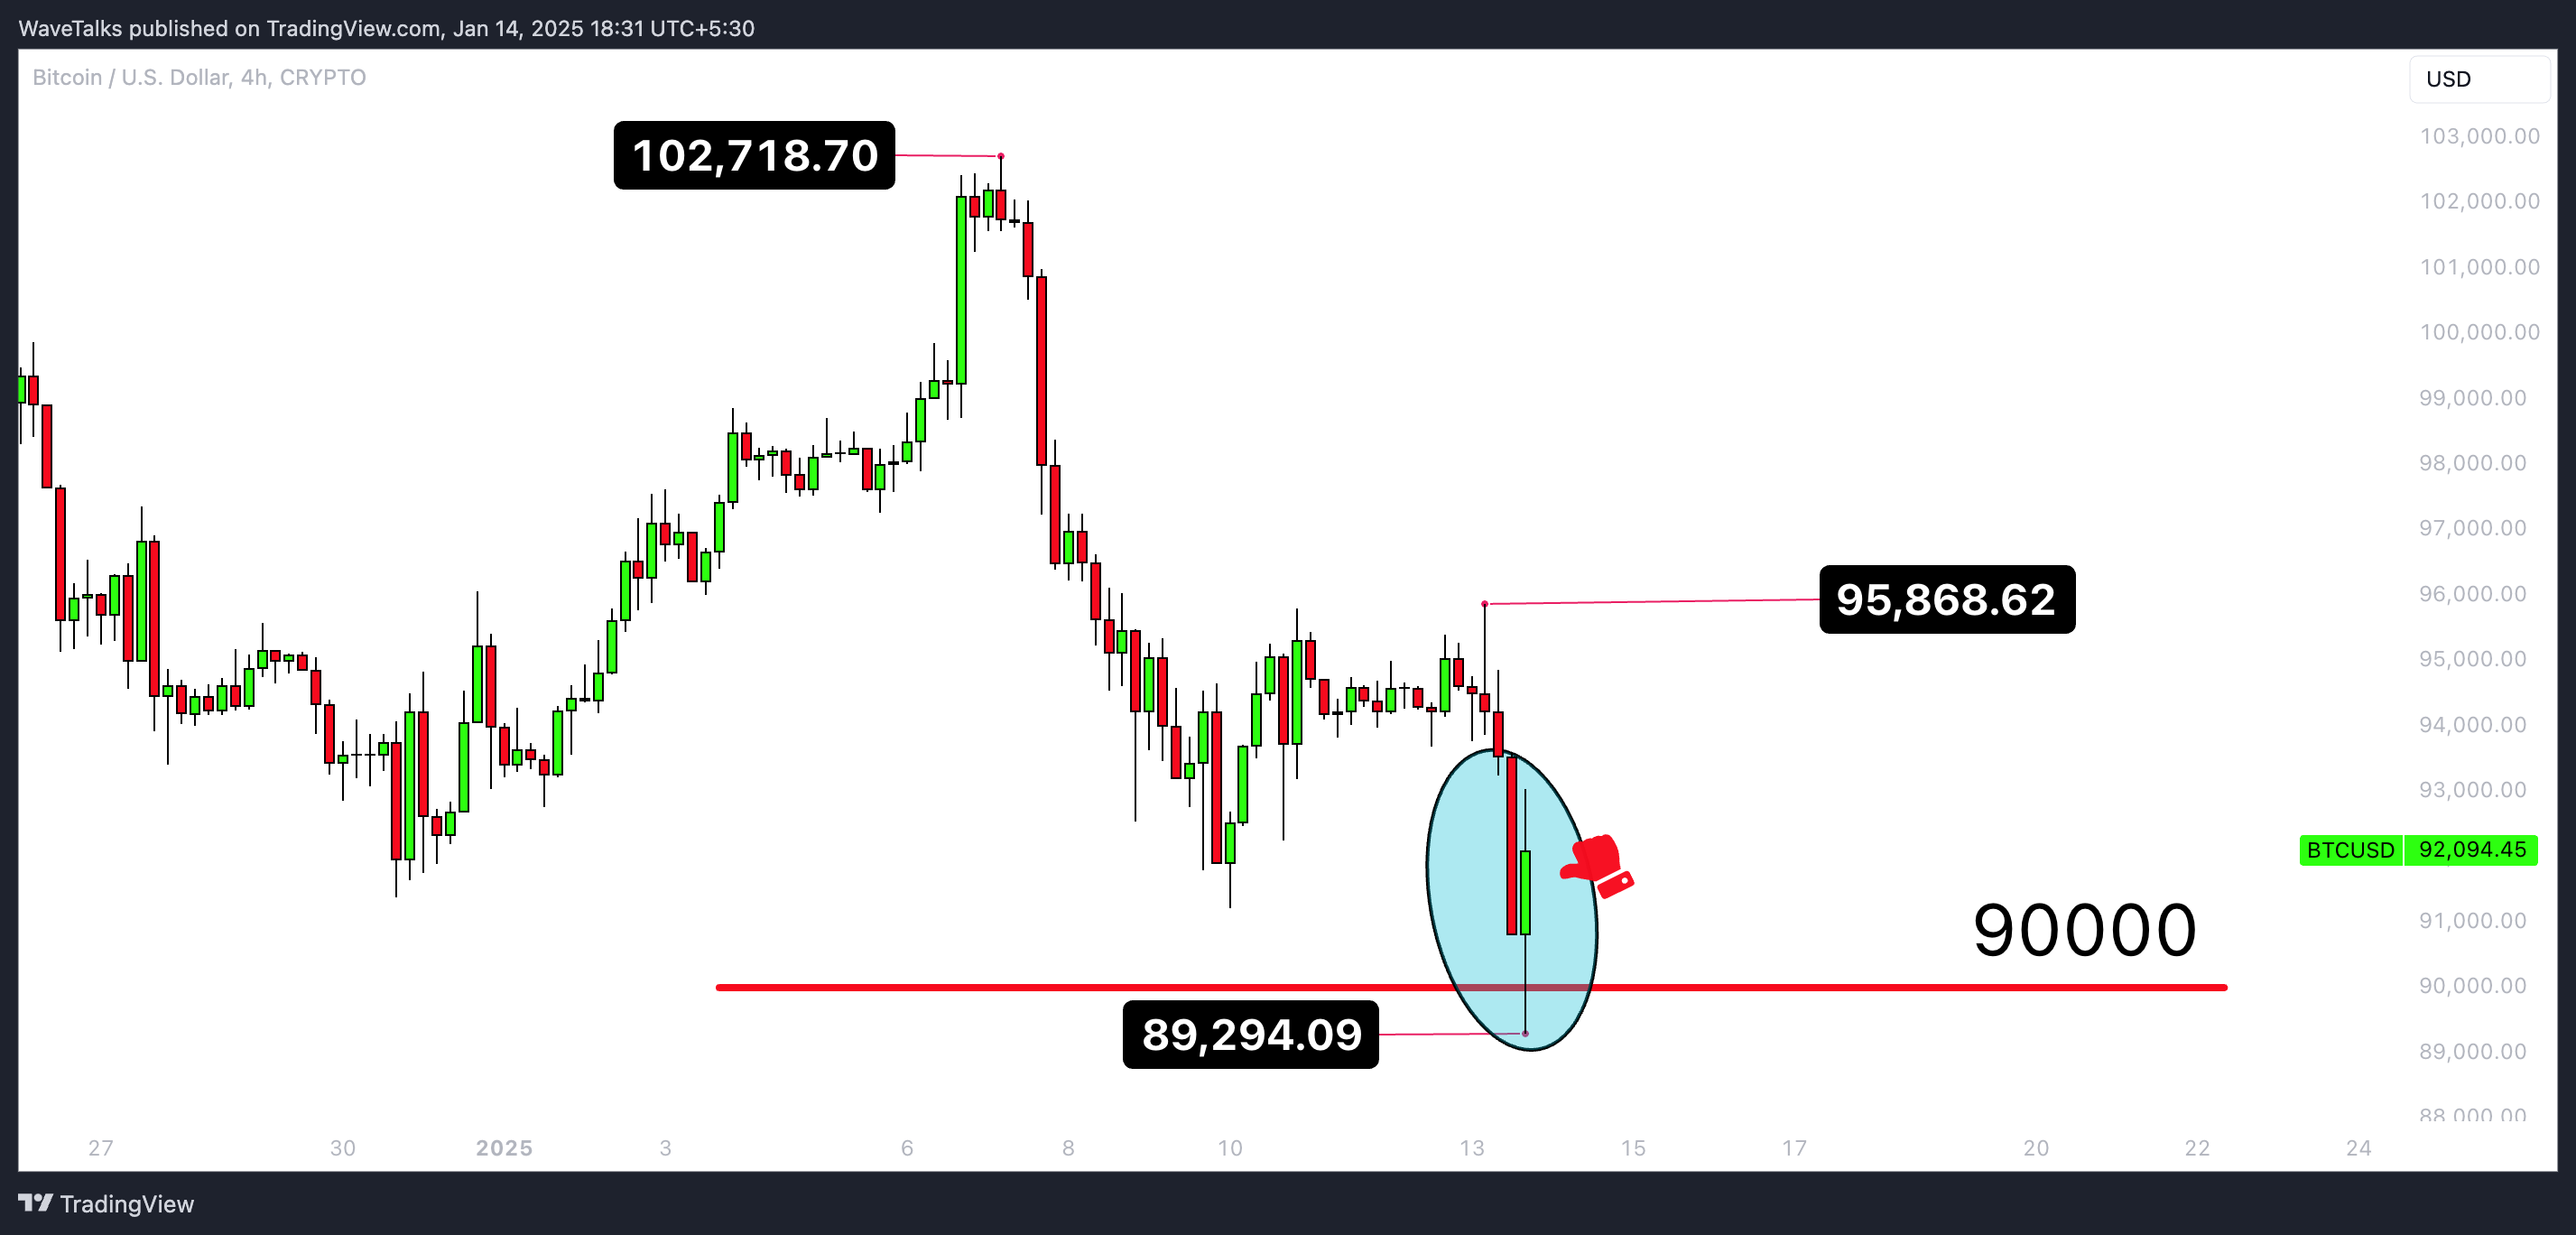
Bitcoin sharply dropped below the psychological 90K level, hitting lows of 89,294 in the evening session yesterday.
-
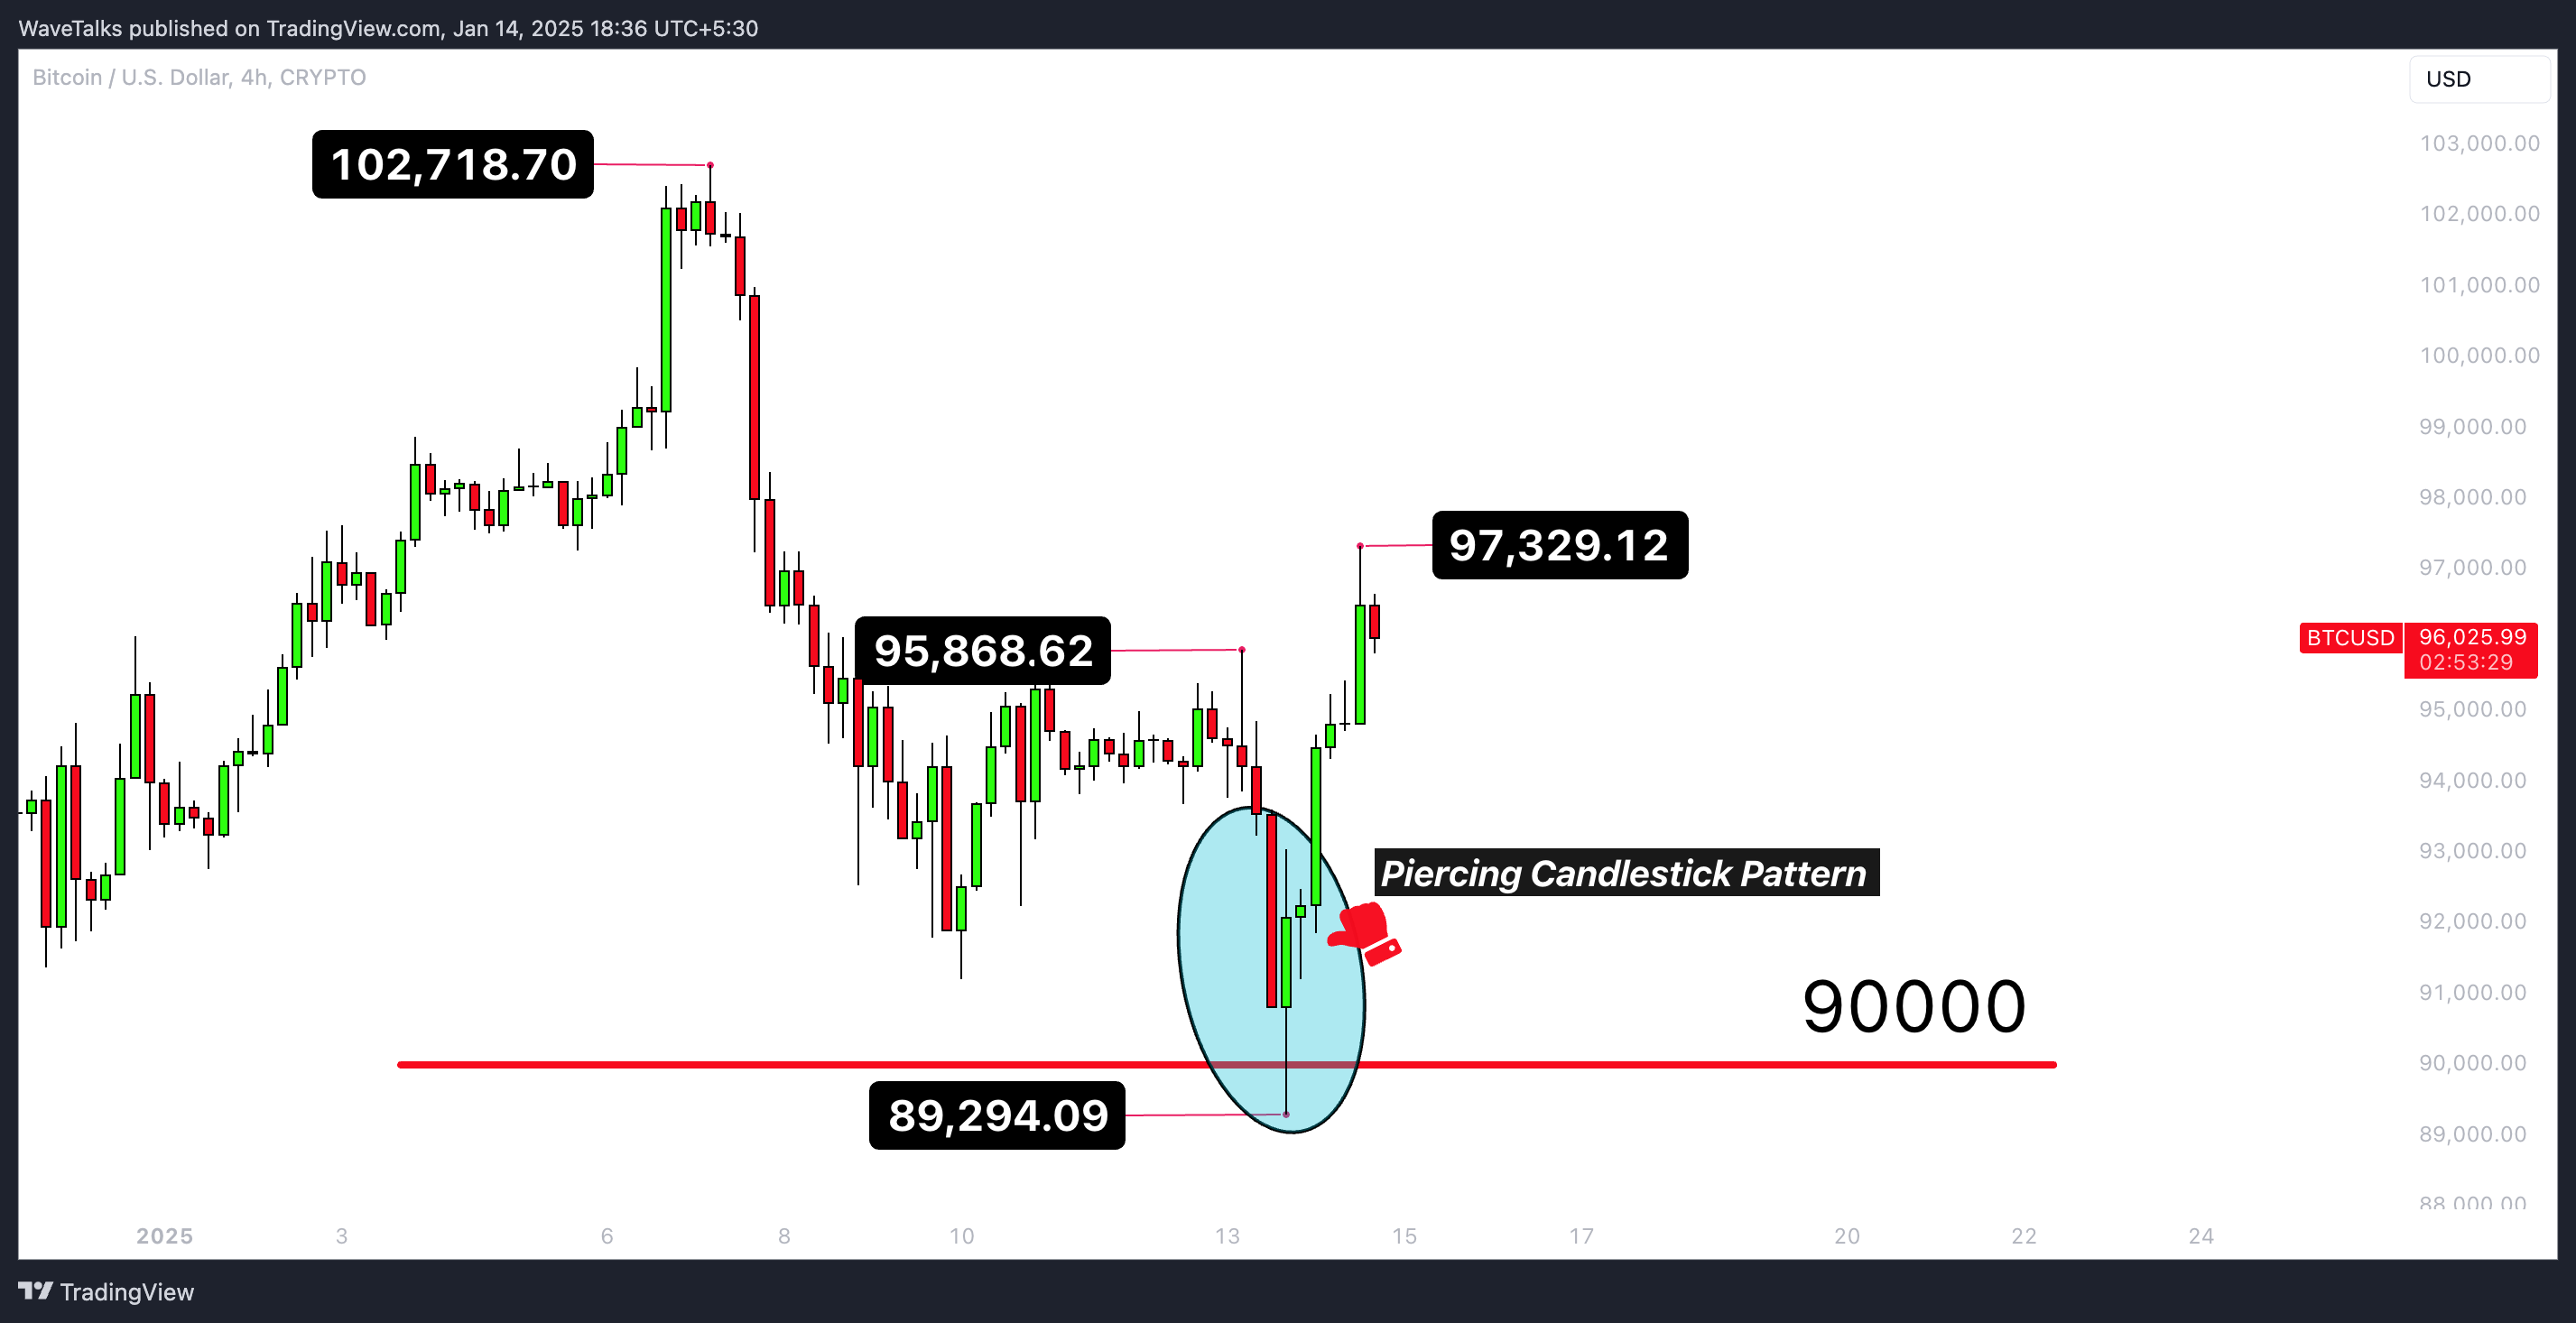
It then staged an impressive recovery, traveling 7,000–8,000 points to touch close by 98K, aligning perfectly with the Piercing Candlestick pattern observed on the 4-hour chart, which hinted at a potential reversal as discussed.
-
-
Symbolism with mahakumbh and makar sankranti:
-
The timing of this move coincides with India’s Makar Sankranti, a festival marking the Sun's transition into Capricorn. Historically, this period is considered optimistic for Indian equities, which also rebounded after a long downfall of 26 Day Session topping out last on 5th Dec 2024.
-
Bitcoin’s move reflects this optimism, suggesting market sentiment is aligned with auspicious beginnings, similar to the spiritual significance of Mahakumbh 2025.
-
-
Resistance at 98k:
-
Bitcoin faces natural resistance near 98K, with a possible sideways phase ahead before attempting a breakout towards 100K- The most important level.
-
Key levels to watch
-
Resistance zones:
-
98,000–100,000: Immediate resistance. Crossing 100K will be a psychological breakthrough and requires fresh analysis for higher targets.
-
-
Support zones:
-
90,000–91,000: Critical support zone; holding this level will keep the bullish momentum alive.
-
-
Consolidation likely:
-
Bitcoin may range between 90K–98K in the short term before making a decisive move & near term resistance above 98K to be 100K level to be noted.
-
Candlestick pattern
-
Piercing candlestick on the 4-hour chart:
This classic bullish reversal candlestick pattern was the key driver of the bounce. It reflects a strong buying sentiment, confirming the 90K level as a critical support level.
Spotting a Piercing Candlestick Pattern? was a sign of a potential rebound unfolded in late evening session yesterday, with buyers stepping in after a sharp drop as discussed.
What a bounce from 90 to 98K approx (Target reached).
What’s next for Bitcoin?
-
Scenario 1 – Break above 98K:
-
A breakout beyond 98K will likely target the psychological 100K mark. Anything above 100K will require a new wave analysis to determine the next targets.
-
-
Scenario 2 – Sideways movement:
-
If Bitcoin holds below 98K, it would be sideways & choppy session for next few days with immediate support zone between 93 to 95K setting the stage for a larger move in either direction later.
-
-
Scenario 3 – Drop below 90K:
-
A drop below 90K would could trigger downside move towards 85K or even 75K to be reviewed later.
-
Conclusion
Bitcoin’s recovery from 89,294 to 98K approx demonstrates its resilience, much like the symbolic cleansing and renewal during the Mahakumbh’s holy dip. Consolidation between 90K–98K seems likely in the short term, but a breakout above 100K could redefine the bullish narrative. Traders should stay alert to market signals and adjust their strategies accordingly.
Author

Abhishek H. Singh
WaveTalks
Abhishek is a seasoned financial analyst with over a decade of experience specializing in Elliott Wave Theory.


