Bitcoin weekly outlook: IBIT and MicroStrategy defend key support floors

Update to the Feb 7 framework: the structure map is unchanged, but price is back at key floors, making acceptance vs. rejection the main focus.
Bitcoin (BTC/USD) weekly outlook: IBIT ETF and MSTR defend key support floors
Update note: This report is a continuation of the Feb 7 framework. The structure maps and levels remain the same — what’s changed is price location and behaviour around those levels.
This weekly technical outlook covers Bitcoin (BTC/USD), the iShares Bitcoin Trust ETF (IBIT), and MicroStrategy (MSTR) as all three test major support zones after the sell-off. The focus isn’t prediction — it’s tracking whether price accepts back into internal structure (repair) or rejects and breaks the floors (next downside phase).
Across the BTC complex, the tape is starting to look less aggressive at the lows, with multiple floors being defended. The next phase depends on how price responds at the key levels below.
Key levels snapshot
BTC/USD (weekly)
- Reclaim trigger: 71,200
- Key floor: 62,500–62,550
- If 62,500 fails,the next demand focus shifts toward the mid-50k zone
IBIT (weekly) — Spot Bitcoin ETF wrapper
- Key floor/decisionidentity/pivot band: 35.00
- Repair trigger: acceptance above 38.38 / 40.10
- Range identity/pivot: 47.00 (CP)
- If 35 fails: 34.00 → 32.84 → 31.98 → 28.00
MSTR (Weekly) — High-beta BTC proxy
- Demand band (current battlefield): 109.00–136.98
- Repair trigger: reclaim and hold 136.98
- Recovery ladder: 154.14 → 168.00 → 181.87 → 201.61 → 226.75
- If 109 fails: 98 → 92, then 86 → 81 → 73 → 64.37
BTC/USD (weekly): Crucial zone holding as selling pressure cools

BTC remains inside the same larger weekly structure from 2025. The current decision band is doing its job: buyers are responding, and the market is attempting to base rather than cascade.
Structure read
Weekly price action is starting to show less aggressive selling pressure inside the 71,200–62,500 zone, with buyers defending the floor and the market beginning to behave more like stabilisation than continuation.
What’s next
- Hold 62,500–62,550 + reclaim 71,200: supports a shift into two-way repair, with 71,200 acting like the pivot and 62,550 acting as the floor.
- Lose 62,500: shifts BTC into the next downside pocket, with the mid-50k zone becoming the next area to watch for a demand response.
IBIT (weekly): 35 holds again as the repair path stays alive
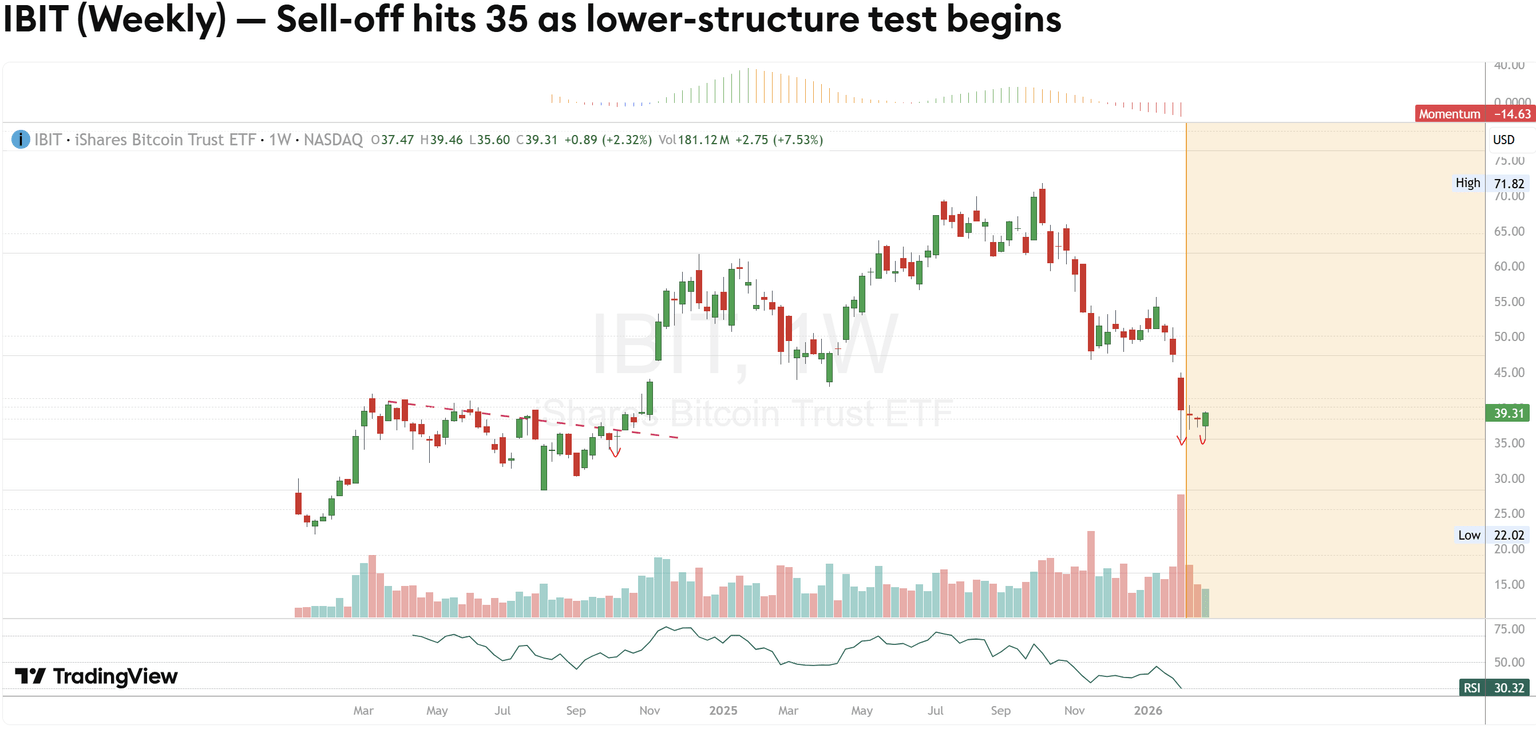
IBIT is still trading within the same weekly two-way structure outlined in the Feb 7 report. The key development on the updated chart is simple: 35.00 has been defended again, confirming it as the active floor of the current structure.
Why the second hold matters
A second defence of 35.00 reduces the odds of a clean one-way unwind and supports the idea that IBIT is shifting into stabilisation and repair — matching what’s showing up in BTC/USD at its own floor zone.
Internal rebuild ladder (if 35 holds)
38.38 → 40.10 → 41.50 → 42.87 → 44.85 → 47.00 (CP)
The next test is acceptance, not a tag. IBIT can bounce into 38.38/40.10, but the tape only improves if it can hold above that band and start printing stronger weekly closes. Until 47.00 is reclaimed, rallies can still behave like repair rather than a full recovery.
If 35 fails (next phase)
34.00 → 32.84 → 31.98 → 28.00
MSTR (weekly): Demand band still in play as 109 holds for three weeks

MSTR is also running the same structure map as the Feb 7 report. The update is constructive in one specific way: 109 has held for three consecutive weeks, keeping price anchored inside the lower-structure demand band.
Current battlefield
- 109.00–136.98 = demand band
- 109.00 = active floor
This floor aligns with the broader 2024 base, and the repeated hold suggests buyers are willing to accumulate inside demand rather than step away. That’s often what shows up when selling pressure begins to fade — not a reversal signal, but stabilisation behaviour.
What changes the tape (repair trigger)
- 136.98 reclaimed and held = early repair with structure behind it
Recovery ladder (if 136.98 is reclaimed)
154.14 → 168.00 → 181.87 → 201.61 → 226.75 (pivot)
If the demand band fails (risk extension)
- 109 breaks → 98 → 92 (must-hold zone)
- Below 92, the lower ladder opens: 86 → 81 → 73 → 64.37
How to read this as one package
- BTC sets the base-layer floor test.
- IBIT shows whether support is showing up through traditional ETF rails.
- MSTR is the high-beta proxy — it often exaggerates both recovery attempts and unwind risk.
Right now, all three are sending a similar message: floors are being defended, and the complex is shifting from forced selling into a phase where acceptance back into the internal structure decides whether repair can be built.
Bottom line
The sell-off may not be “over,” but the behaviour is changing: the downside is becoming less productive at key floors. If BTC can reclaim 71,200, IBIT can accept above 38.38/40.10, and MSTR can reclaim 136.98, the next phase likely becomes a two-way repair market rather than a straight-line unwind.
If those floors fail instead, the complex remains vulnerable to the next downside extension zones already mapped.
These levels aren’t forecasts — they’re reference points. The job is to track whether prices are accepted above them, rejected below them.
Structure defines context; price reveals response.
Author

Denis Joeli Fatiaki
Independent Analyst
Denis Joeli Fatiaki possesses over a decade of extensive experience as a multi-asset trader and Market Strategist.


