Bitcoin Weekly Forecast: BTC ogles into a rift amid looming losses to $23,000
- Bitcoin price is trading below a crucial support level as traders and investors battle FUD.
- The correction follows a brief rally triggered by US CPI inflation data at 4.9% year-on-year, 0.1% lower than the expected 5% rise.
- The recent reversal preempts the continuation of a downtrend after BTC turned away from its 10-month high of around $31,050 attained on April 14.
- The governing technical formation could see the king crypto revisit the $23,000 zone.

Bitcoin (BTC) price is trading below a crucial support level amid Fear, Uncertainty, and Doubt (FUD) gripping market participants. The correction comes after a brief rally triggered by the US Consumer Price Index (CPI) inflation reading, which came in at 4.9%, 0.1% lower than what economists had predicted on a year-on-year basis.
The #FUD signs are all over social media as traders are showing skepticism that #Bitcoin can regain the coveted $30k level once again. Our latest video market update covers the latest whale activity, and other important metrics you should be watching. https://t.co/fEYBT0mgX3 pic.twitter.com/j4Pfk70yWg
— Santiment (@santimentfeed) May 11, 2023
With the recent downturn end ensuing price action, Bitcoin price indicates the continuation of a downtrend. This weekly forecast extrapolated from the April 10 high when BTC turned away from its 10-month high around $31,000.
Also Read: Bitcoin Ordinals dropping popularity sees BTC hashrate and price decline
Bitcoin price slides below $27,000 – where will BTC go from here?
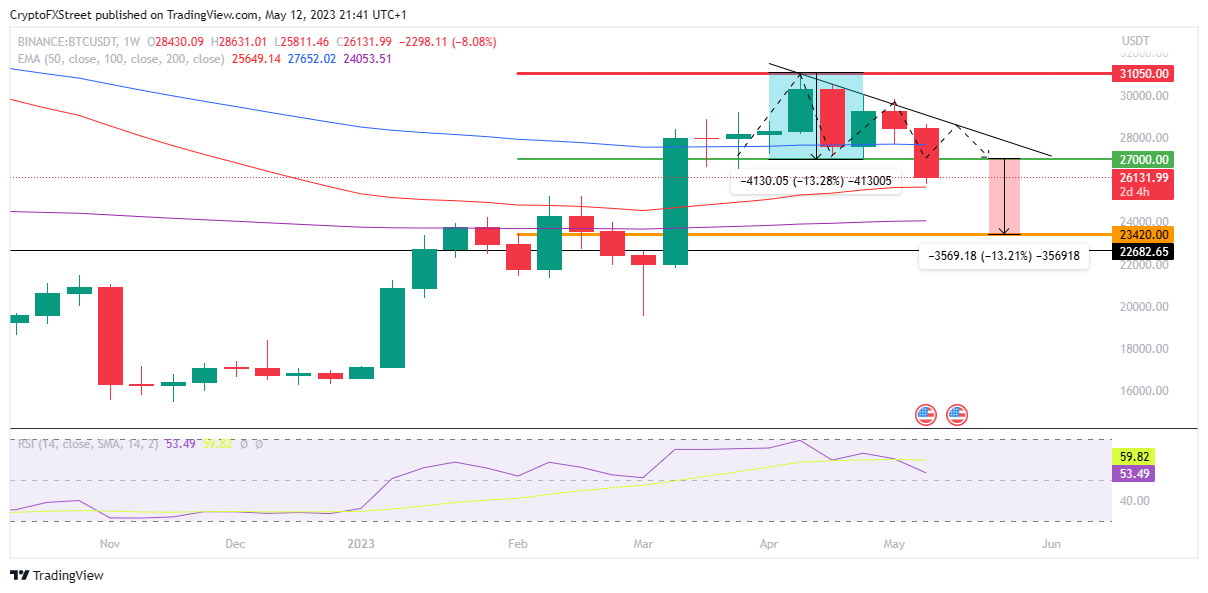
Bitcoin price lost the $27,000 support level on May 11, a key supplier congestion level that had held forte since mid-March, keeping BTC from losing all the ground covered since the beginning of the year. In the same way, the price of the flagship crypto has progressively suffered under the suppressing command of a formidable descending trendline for the past month.
With such price action, a descending triangle has manifested on the one-week chart, as shown below. This significantly bearish technical formation preempts an exact bearish breakout target whose stretch is determined by measuring the thickest part of the triangle and superimposing it from the breakout point.
Around April 19, bulls failed in their attempted breakout from the upper boundary, acting as a resistance or downtrend line. The same happened in early May, with both breakout attempts proving immature as bulls lacked sufficient strength to breach the barricade.
In the aftermath, Bitcoin price continues to recoil within this descending triangle, with the resistance line commandeering and shepherding the price lower. A break below the x-axis of the triangle, presented as the horizontal support line, would confirm the bearish outlook by paving the way for a 13.21% downswing to $23,420, or in the dire case, a leg down to the January 23 lows around $22,682.
BTC/USDT 1-Week Chart
On the downside, the one-week chart above for the BTC/USDT trading pair reveals a powerful supplier congestion zone that stretches from $27,000 to $31,000. This zone could suppress Bitcoin price further, preventing the king crypto from scaling an immediate rebound.
Notably, within this zone, the 50-day Exponential Moving Average (EMA), the triangle’s resistance line, and the $30,000 psychological level are presented. This indicates taut hurdles in Bitcoin price’s recovery path.
Besides, the Relative Strength Index (RSI) showed that the bears’ grip on the bellwether cryptocurrency was firm. This trend-following indicator was facing down, and the price strength at 34 suggested that there was still more room for the downside.
The bearish thesis would only be invalidated upon a decisive weekly candlestick close above the triangle’s resistance line at around $28,000. Nevertheless, a resurgence above the $27,000 level would suggest an aggressive bullish effort to defend against further losses.
Such a move would increase the chances for Bitcoin price to rise toward the $31,050 resistance level, denoting a 15% upswing from the current level.
On-chain metrics: Bitcoin price falls in the wake of bearish social sentiment
Data from cryptocurrency intelligence site, Santiment shows that the downturn in Bitcoin price comes when overall sentiment among market players is turning bearish across social media platforms.
 [22.45.53, 12 May, 2023]-638195238290470721.png)
As shown in the chart above, the social dominance Twitter news metric is down almost 20%. This metric shows the share of the coin’s mentions on Twitter relative to a pool of over 50 of the most popular projects online.
As Bitcoin price falls below the $27,000 support level, investors’ sentiment for the king crypto across all social media platforms continues to be negative. Santiment, the popular on-chain data and social metrics analysis platform has indicated this, concluding:
FUD signs are all over social media” as traders remain skeptical about BTC’s ability to return to the “coveted $30k level.
Further, data from the market intelligence firm indicates that social media talks about the top 100 cryptocurrencies by market cap continue to drop relative to the past month. Particularly, Bitcoin discussions, among other altcoins that boast large market caps, have dropped by 18%.
Nevertheless, Brian Quinlivan, an on-chain analyst and marketing executive with Santiment, believes that the prevailing Bitcoin price correction provides an opportunity for sidelined investors to buy BTC at low rates.
While Bitcoin price records losses aggregating to 10% over the past month, Ethereum (ETH) price has posted similar drawdowns akin to other 10-non-stablecoin cryptocurrencies on the CoinMarketCap list. This represents one of the largest 30-day drops since June 2022 and comes on the back of the Fed’s interest rate hikes and varying macroeconomic conditions regionally and the world over.
Author

Lockridge Okoth
FXStreet
Lockridge is a believer in the transformative power of crypto and the blockchain industry.


