Bitcoin Weekly Forecast: BTC 2.0 gaining momentum, but price remains below all-time high
- Bitcoin price closes with the best March and Q1 since 2013.
- Visa and Paypal expand commitment to BTC.
- New Morgan Stanley funds can hold up to 25% BTC exposure.

Bitcoin price with 440% returns over the last six months, 108% in Q1, and almost 30% this month reflect the evolution of BTC from a speculative asset to a means of payment and a store of value for individual and institutional investors. The critical question becomes whether Bitcoin price already reflects this commitment and optimism.
Bitcoin’s increasing dependence on institutional money and adoption is long-term bullish
For a bit of background, Tesla recently introduced the ability to purchase automobiles with BTC, payment processing leader Visa announced the full integration of the USDC stablecoin into their payment system, and PayPal will now offer clients the ability to instantly convert their Bitcoin, Ethereum, Litecoin, or Bitcoin Cash to US dollars that PayPal then uses to pay merchants.
Furthermore, Morgan Stanley announced new investment portfolios in Advantage, Asia Opportunity, Counterpoint Global, Developing Opportunity, Global Advantage, and seven others with room for Bitcoin exposure up to 25% via foreign subsidiaries. BNY Mellon, only a month after disclosing it would be expanding its custodial services to include cryptocurrencies, revealed it was analyzing potential models to calculate how valuable BTC may be worth in the future. The venerable financial institution Goldman Sachs notified clients of notable wealth that they would have access to derivative and traditional instruments based on the cryptocurrency.
Even with all this news, the all-time high at $61,788 remains unchallenged. It is clear, as displayed by Bitcoin price action this week, that the combination of new long-term investment vehicles, constant retail bullishness, and growing acceptance of BTC into the international payment system has only been able to maintain price levels.
Has bitcoin already priced in the bullish developments?
From a broader analysis, there is no reason to question the robustness of the bull market. Still, maybe it is time to entertain the prospect that BTC could be forming a short-term, complex top in the formation of an ascending wedge pattern under the 3.618 Fibonacci extension of the 2017-2018 bear market at $63,778.
Based on the ascending wedge pattern, BTC will likely print a new high in the coming days, but it will be short-lived and most likely with a negative momentum divergence on the Relative Strength Index (RSI).
It should be recognized that the ascending pattern could last several weeks before it is resolved. A bullish resolution would target the 4.618 Fibonacci extension of the 2017-2018 bear market at $80,541.
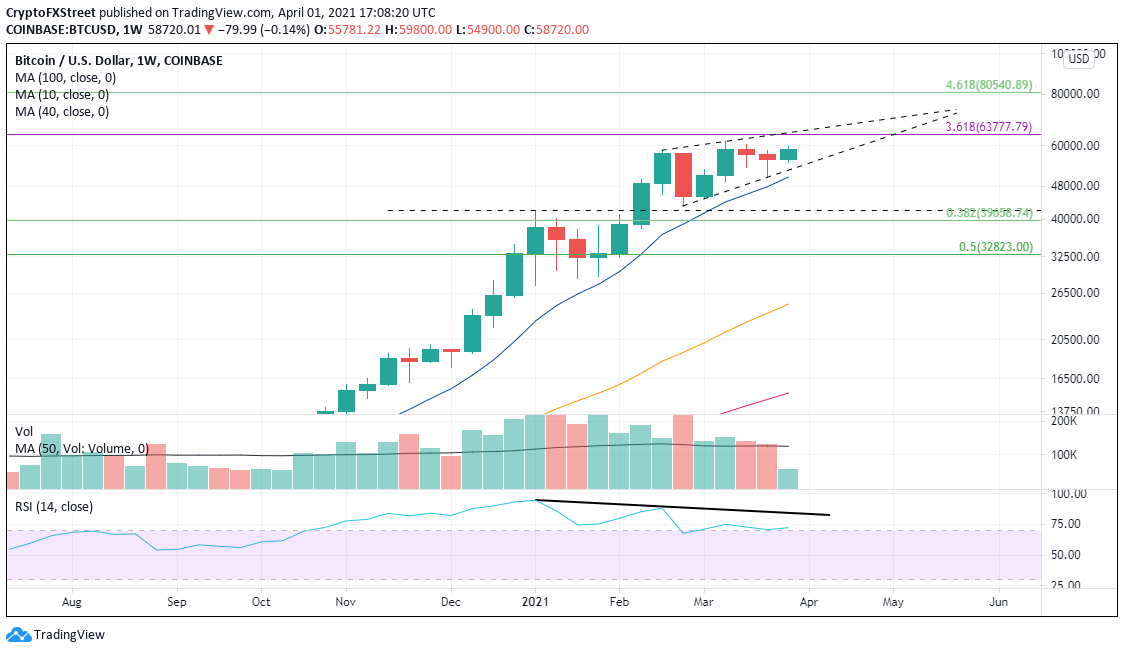
BTC/USD weekly chart
On the other hand, if BTC declines below the lower trend line, it needs to hold the 10-week SMA at $50,519. A failure to hold would turn a short-term correction into a more profound decline and a quick test of the January high at $41,986 followed by the 0.382 Fibonacci retracement level of the 2020-2021 bull market at $39,659. Further support appears at the 0.50 retracement level at $32,823.
The fundamental backdrop is bullish, but an overbought condition on the longer-term charts does risk another shake-out before a sustainable rally. Corrections are healthy, and the main risk level is precise, so traders and investors need some patience to let the ascending wedge pattern resolve.
Author

Sheldon McIntyre, CMT
Independent Analyst
Sheldon has 24 years of investment experience holding various positions in companies based in the United States and Chile. His core competencies include BRIC and G-10 equity markets, swing and position trading and technical analysis.




