- Bitcoin briefly hit the $22,000 level before retreating to the $21,700 level in the recent correction.
- Bloomberg analysts believe traders are awaiting US inflation data and a successful completion of the Ethereum Merge, before making a move.
- Analysts predict a comeback in Bitcoin price, identified a bullish engulfing candle in the BTC price chart.
Bitcoin price witnessed a slow recovery from its slump as investors waited for the release of CPI data. Analysts believe Bitcoin price could witness a reversal of its downtrend once there is a successful completion of the Merge.
Also read: Ethereum Merge could break the internet according to Preston Van Loon
Bitcoin price rally cools off ahead of CPI data
Bitcoin’s price scaled $22,000 briefly before retracing the $21,700 level. Analysts at Bloomberg believe Bitcon’s price trend can be explained by the anticipation surrounding the release of CPI data and the upcoming Merge.
Ethereum’s Merge and the transition to proof-of-stake is a milestone event in the crypto ecosystem. The community is likely to witness a change in the way Ethereum is created and a massive scale up in the ETH blockchain’s adoption. A hard fork is likely, according to Proof-of-Work supporters, this could result in an airdrop of PoW tokens for PoS holders.
The Merge and resulting consequences could therefore shift trader’s perspective in the crypto ecosystem. The release of CPI data and the Merge could therefore influence Bitcoin’s price. Inflation figures and the upgrade in the Ethereum ecosystem could result in volatility in Bitcoin price trend.
Higher than expected US inflation could harden traders’ expectations and result in a decline in Bitcoin price. Similarly, any roadblock or challenge faced by the Ethereum blockchain could hurt trader sentiment and result in decrease in capital inflow to the crypto ecosystem.
Analysts identifies bullish signal in BTC price chart
Phoenix Ashes, a pseudonymous crypto analyst evaluated the Bitcoin price chart and noted that there is no bullish divergence in sight. The analyst commented on Bitcoin’s price chart in a recent tweet:
We didn't get that bullish divergence, tho we came close
— Phoenix (@Phoenix_Ash3s) September 11, 2022
Just like we did in 2019
What we do get is a bullish engulfing weekly candle
Just like we did in 2019
History still rhymes a whole damn lot $BTC #Bitcoin pic.twitter.com/PZvtzJNqYZ
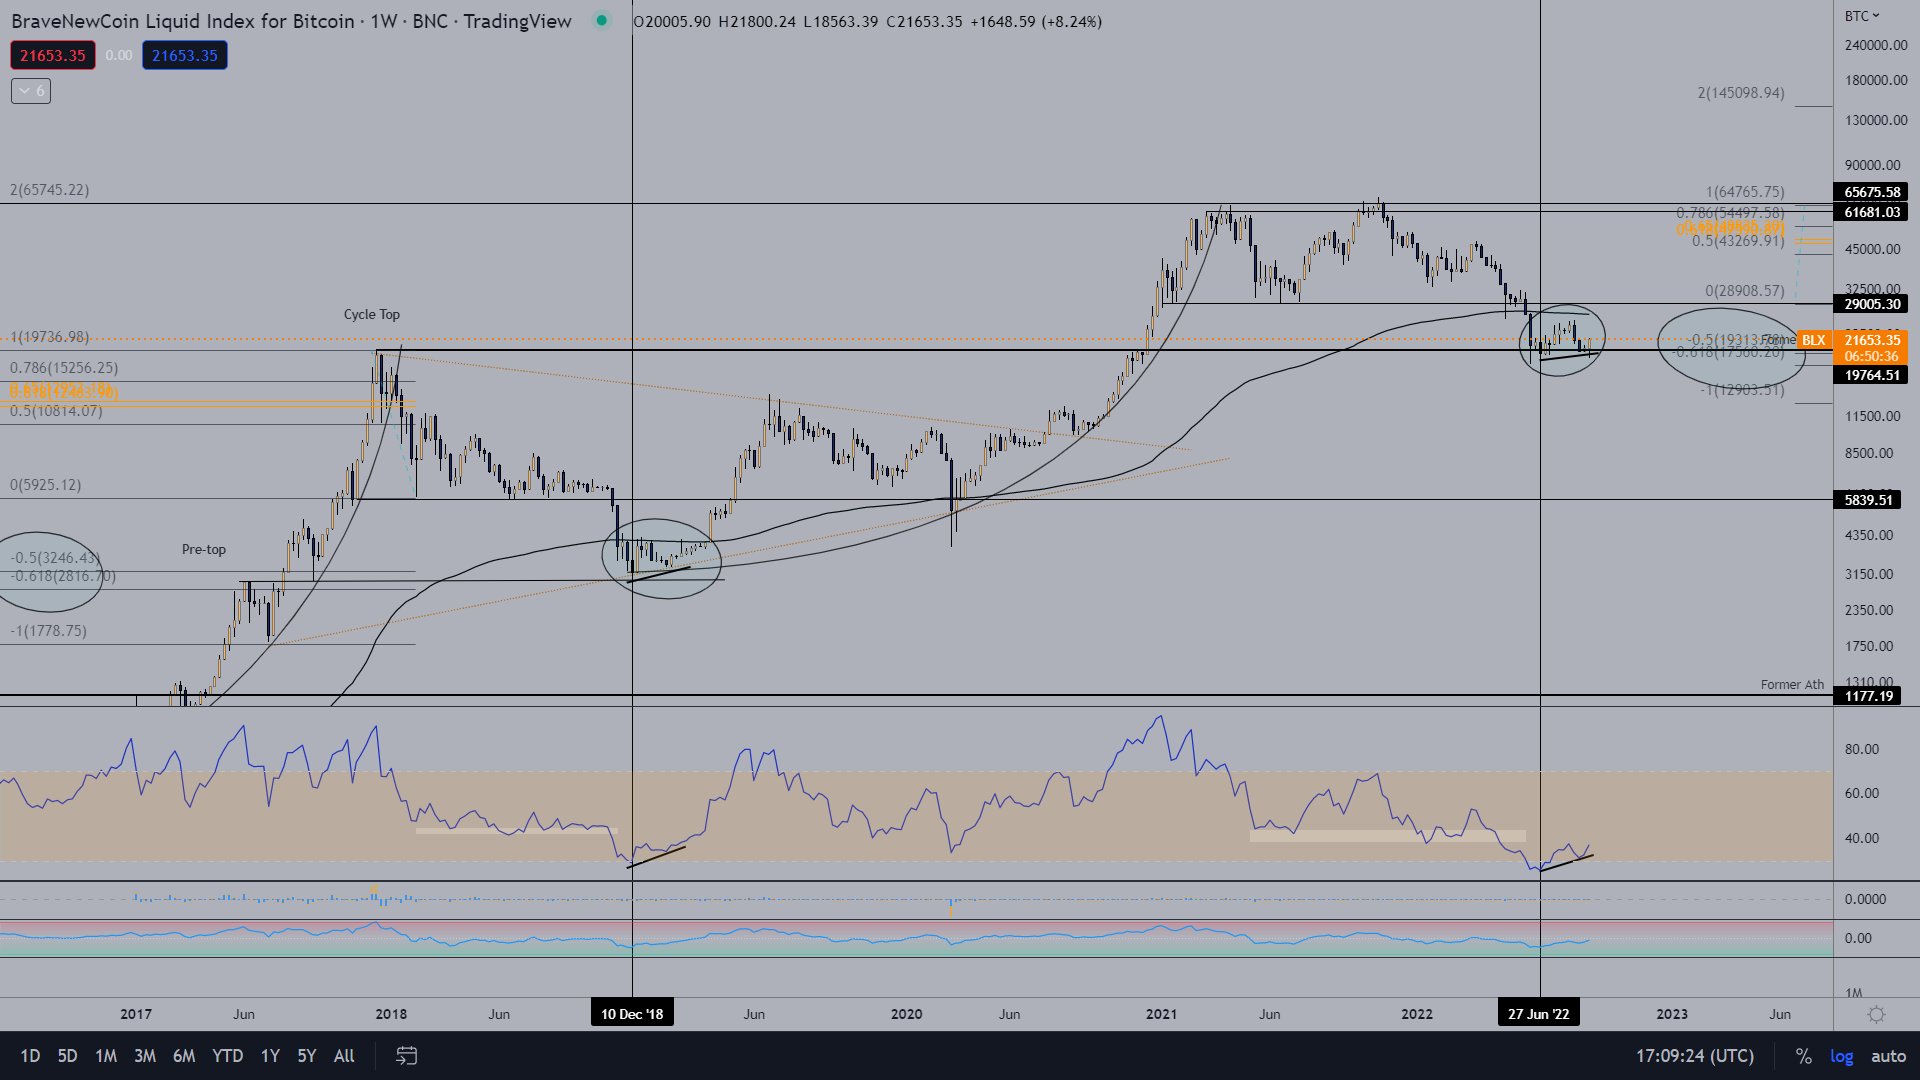
BraveNewCoin liquid index for Bitcoin
RektProof, a crypto trader argues that Bitcoin price could retrace lower, to the $18,600 level before its rally. The analyst has therefore identified two key areas of interest to open shorts. The $20,000 level and the $26,000 level are the two key points on Bitcoin’s price trend where the analyst expects a correction, therefore an opportunity for a short.
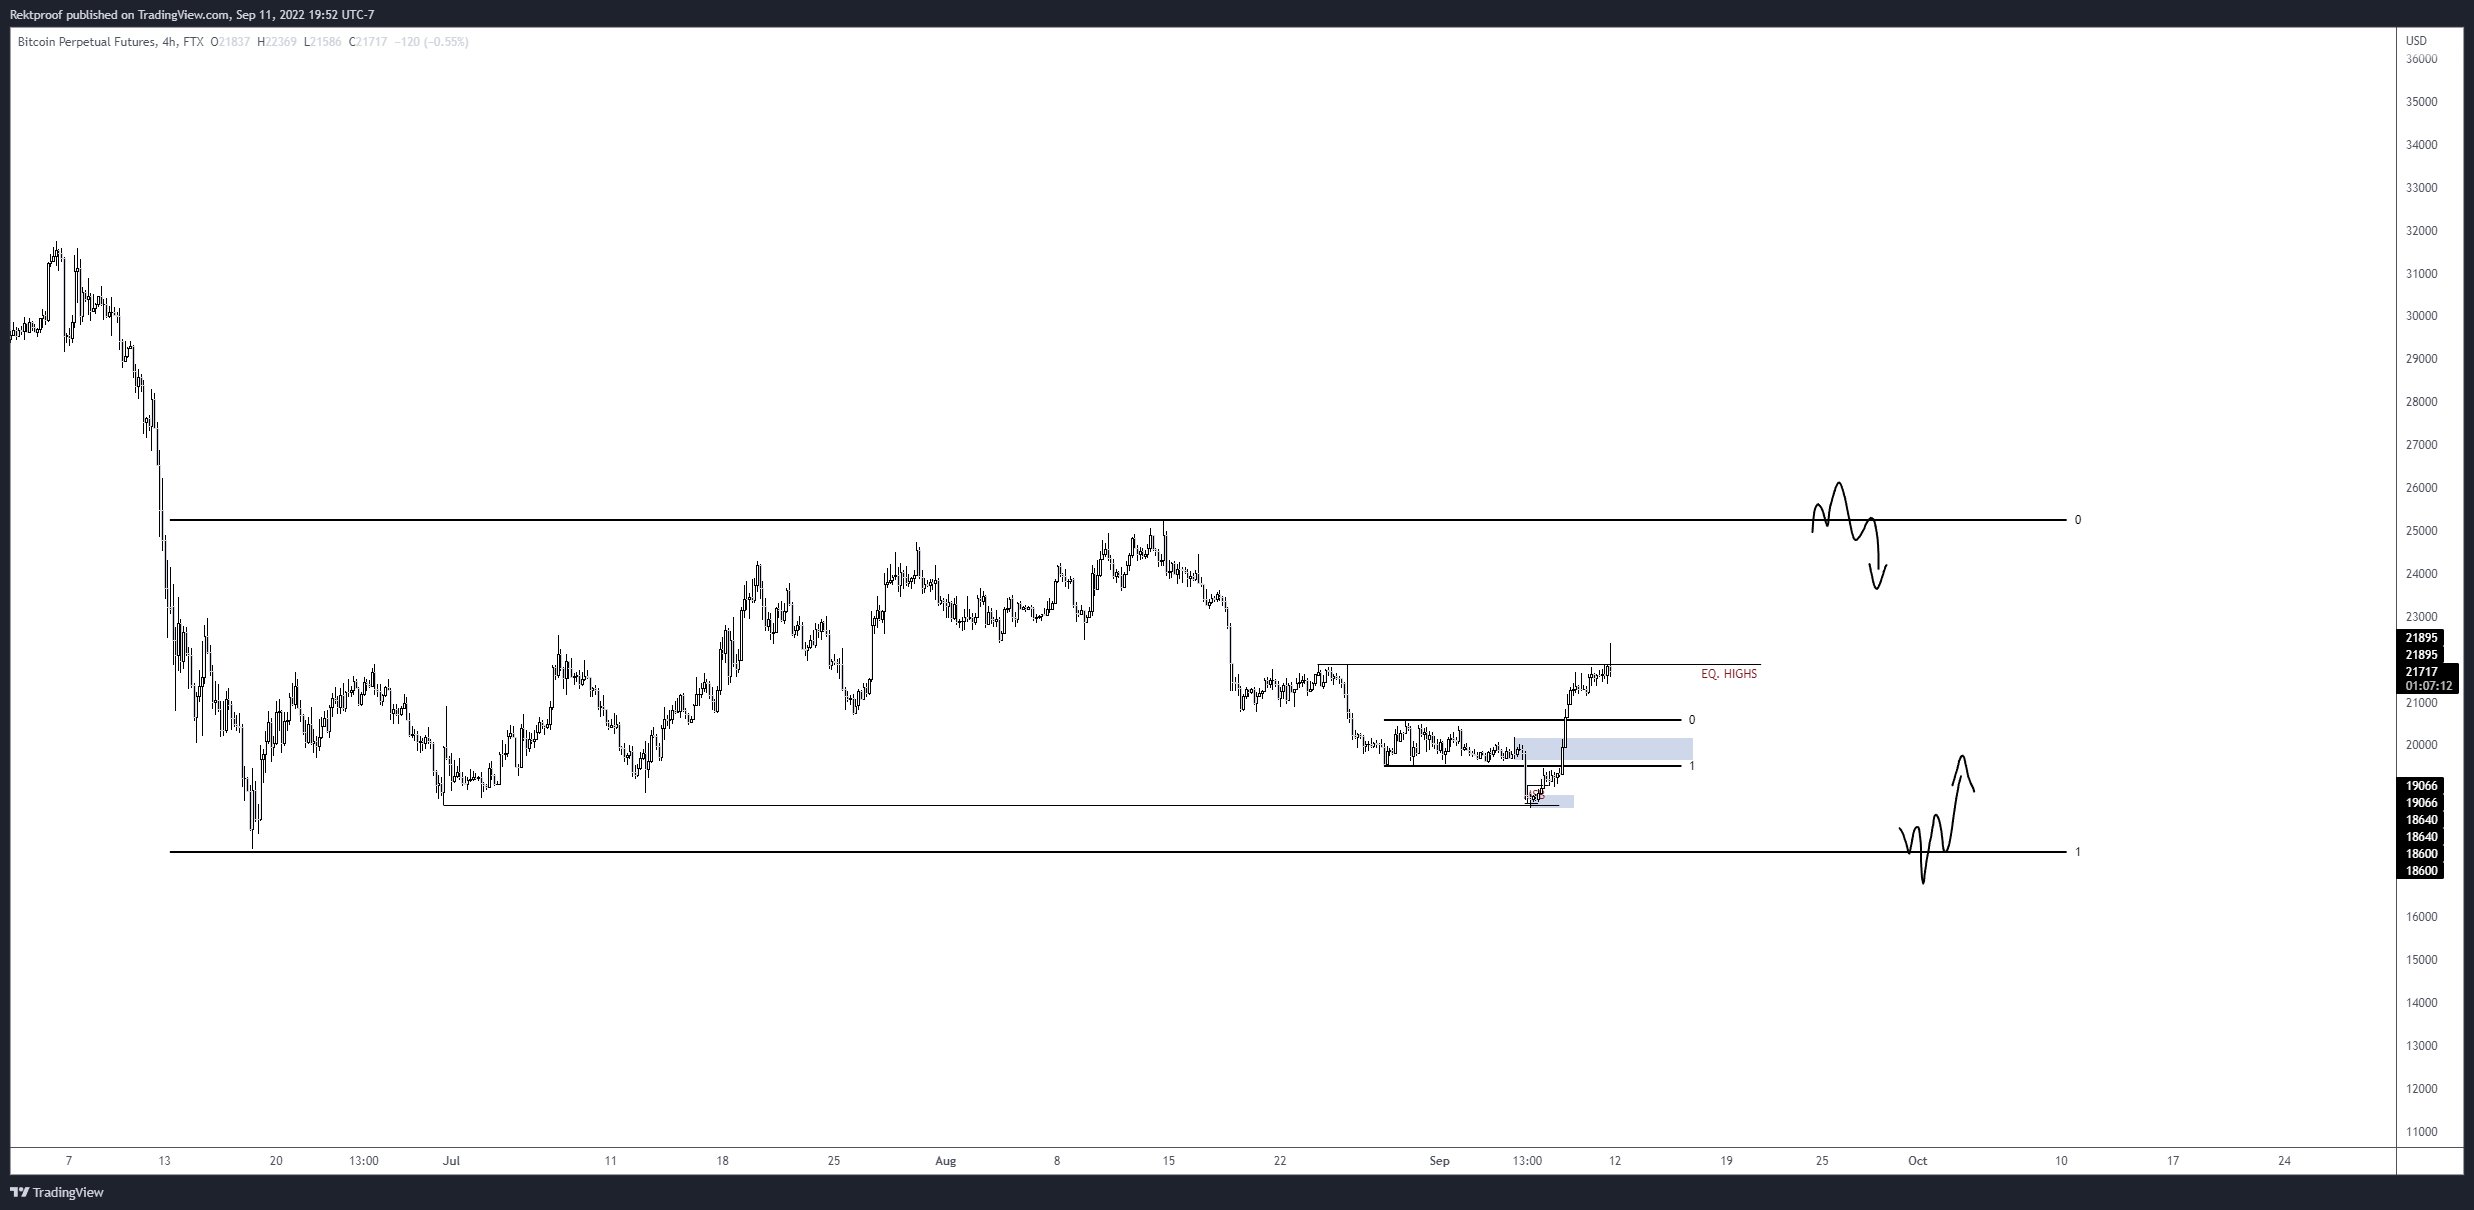
Bitcoin Perpetual Futures
Information on these pages contains forward-looking statements that involve risks and uncertainties. Markets and instruments profiled on this page are for informational purposes only and should not in any way come across as a recommendation to buy or sell in these assets. You should do your own thorough research before making any investment decisions. FXStreet does not in any way guarantee that this information is free from mistakes, errors, or material misstatements. It also does not guarantee that this information is of a timely nature. Investing in Open Markets involves a great deal of risk, including the loss of all or a portion of your investment, as well as emotional distress. All risks, losses and costs associated with investing, including total loss of principal, are your responsibility. The views and opinions expressed in this article are those of the authors and do not necessarily reflect the official policy or position of FXStreet nor its advertisers. The author will not be held responsible for information that is found at the end of links posted on this page.
If not otherwise explicitly mentioned in the body of the article, at the time of writing, the author has no position in any stock mentioned in this article and no business relationship with any company mentioned. The author has not received compensation for writing this article, other than from FXStreet.
FXStreet and the author do not provide personalized recommendations. The author makes no representations as to the accuracy, completeness, or suitability of this information. FXStreet and the author will not be liable for any errors, omissions or any losses, injuries or damages arising from this information and its display or use. Errors and omissions excepted.
The author and FXStreet are not registered investment advisors and nothing in this article is intended to be investment advice.
Recommended Content
Editors’ Picks
Ripple's move above this key level could trigger nearly 50% rally for XRP
Ripple has overcome a critical resistance level and flipped into a support floor on the weekly time frame. This development happened while XRP tightly consolidated for roughly 250 days. Investors can expect XRP to kickstart a massive rally.
Optimism price outlook with nearly $90 million worth of OP tokens flooding markets on Friday
Optimism volatility has shrunk in the ours leading to the network’s cliff unlock. It joins the likes of dYdX and Sui, which have similar events on their calendars. As token unlocks are often considered bearish catalysts, investors should brace for a reaction after the event.
Top 3 Price Prediction Bitcoin, Ethereum, Ripple: Retail watches from the sidelines with a bias for shorts
Bitcoin could clear $73,777 peak as BTC bulls resurface. Ethereum might fall 10% before next leg up as ETH RSI teases with sell signal. XRP could lose $0.6000 threshold as Ripple bulls fail to show up.
Jito price could hit $6 as JTO coils up inside this bullish pattern
Jito price action shows a potential cup and handle formation. Based on theoretical measurement rules, a successful breakout could yield a 56% rally to $6.0. A breakdown of the $3.86 support level would create a lower low for JTO and invalidate the bullish thesis.
Bitcoin: BTC may have recovered, but is it out of the woods?
Bitcoin’s (BTC) upward momentum has shown a significant decline for the past two weeks or so. This development led to a bearish signal on the weekly and an uncertain outlook on the monthly.