Bitcoin: The triangle breaks down
- BTC breaks down of a triangle on the downside.
- Unless volumes rise, the targets may not ensue.

Bitcoin, the poster boy of the cryptocurrency world, broke down of a triangle as the author expectedly reported earlier (read here), althougth the targets for this breakdown are way lower, but given that volumes are missing in this breakdown, BTC may not head as low as the targets are.
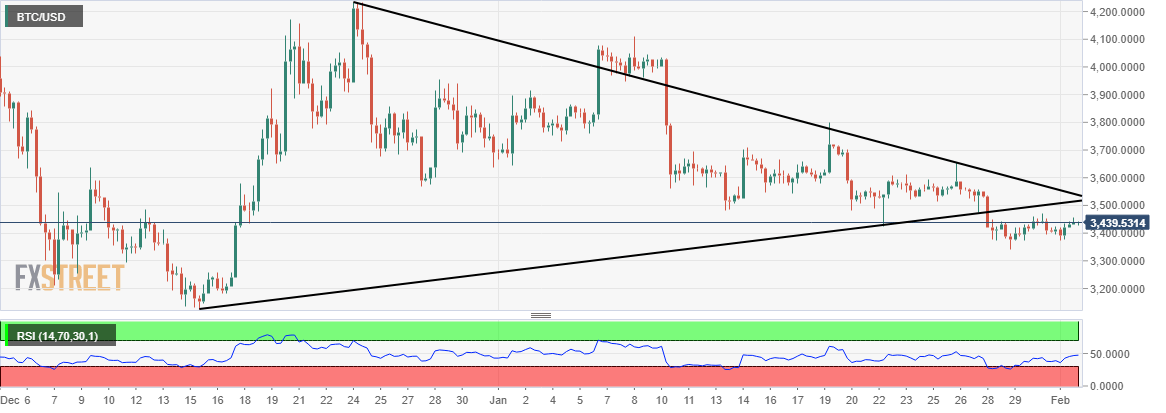
BTC/USD is up just about 0.1 percent on day at $3,440 and trading in less than half a percent range for the day - not a hallmark of an asset class whose second cousin is volatility. On the 360-minute chart of this largest crypto, late last month it broke down of a triangle, which typically should head towards closer to $2,000. But given the fact that volumes and volatility are missing in the crypto world for last few days and weeks, BTC may not head so much lower unless volumes improve.
On the upside though, $3,500 and $3,660 are two immediate hurdles, which must cross for the bulls to negate the triangle breakdown.
BTC/USD 360-minute chart:
Get 24/7 Crypto updates in our social media channels: Give us a follow at @FXSCrypto and our FXStreet Crypto Trading Telegram channel
Author

Manoj B Rawal
Independent Analyst
Manoj B Rawal, financial markets professional with about 11 years of experience in writing, editing and advising on stocks, currencies and fixed income.


