Bitcoin technicals: How low will BTC price go after failing at $42K resistance?

Bitcoin price rejection at $42,000 means BTC is now trying to find new high lows, but at what price levels?
Bitcoin (BTC) has seen an impressive rally of 44% with ten green days in a row. This rally and the substantial number of green days resulted in a sentiment shift. Practically two weeks ago, the market was comparable to a funeral, with many expecting more downside to $20,000.
However, the sentiment completely shifted after the breakout above $31,000. The current sentiment is the expectation of Bitcoin to rally to $100,000 or higher in the second part of this year, while on-chain analysts are back on their game, once again.
Is Bitcoin going to break upwards from here, or will a healthy correction take place? Let's take a look at the technicals.
$42K resistance stops Bitcoin breakout
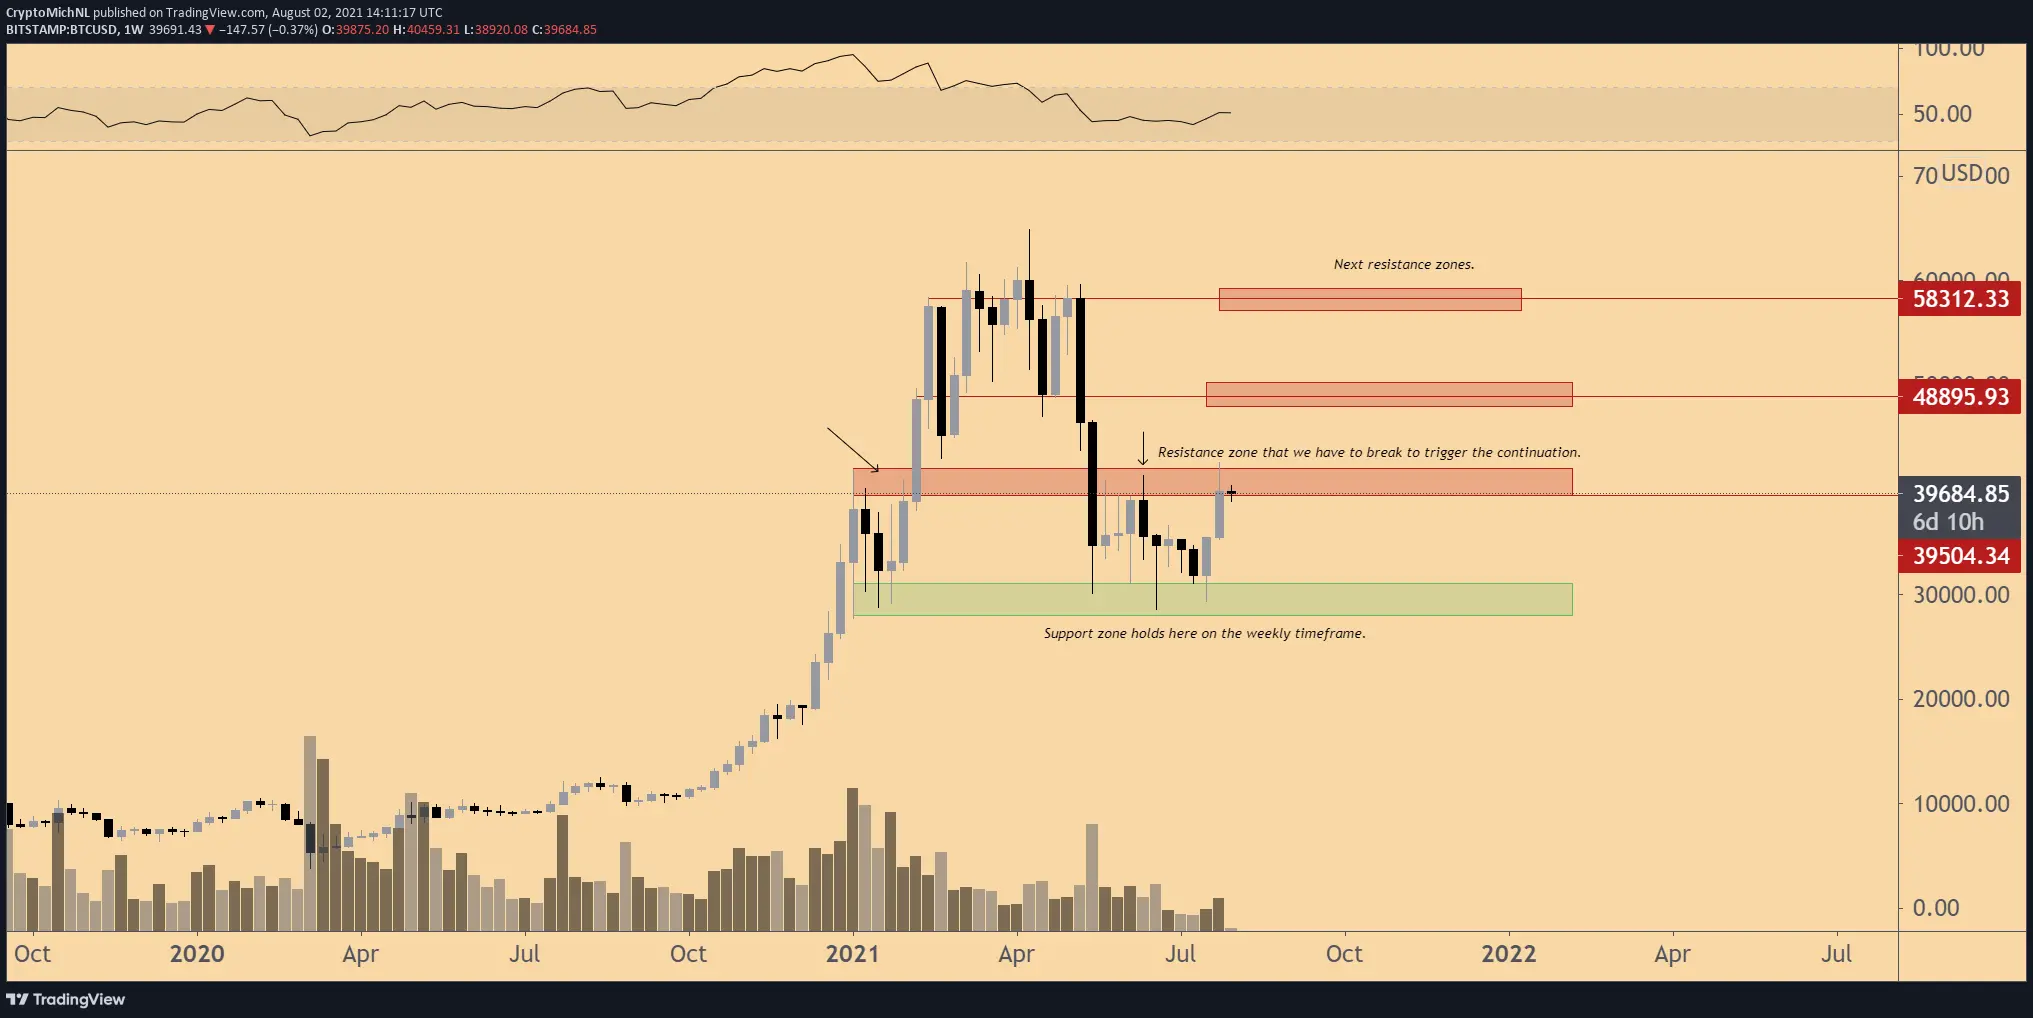
The weekly chart shows the current range-bound construction for BTC/USD. In this construction, a breakout didn’t happen. Last week, Bitcoin’s price tried to break through the resistance zone but couldn’t force a breakout yet.
Therefore, the conclusion is that the market is still unsure about the market direction at this stage. However, the weekly chart also shows apparent support in the zone between $28,000-$31,000. This level has been tested several times and is still holding up as support despite the extreme bearish euphoria the last time Bitcoin’s price visited that range.
Finally, if the market wants more information about the direction, the lower time frames often indicate further clues that should be watched.
Bitcoin daily chart primed for healthy correction
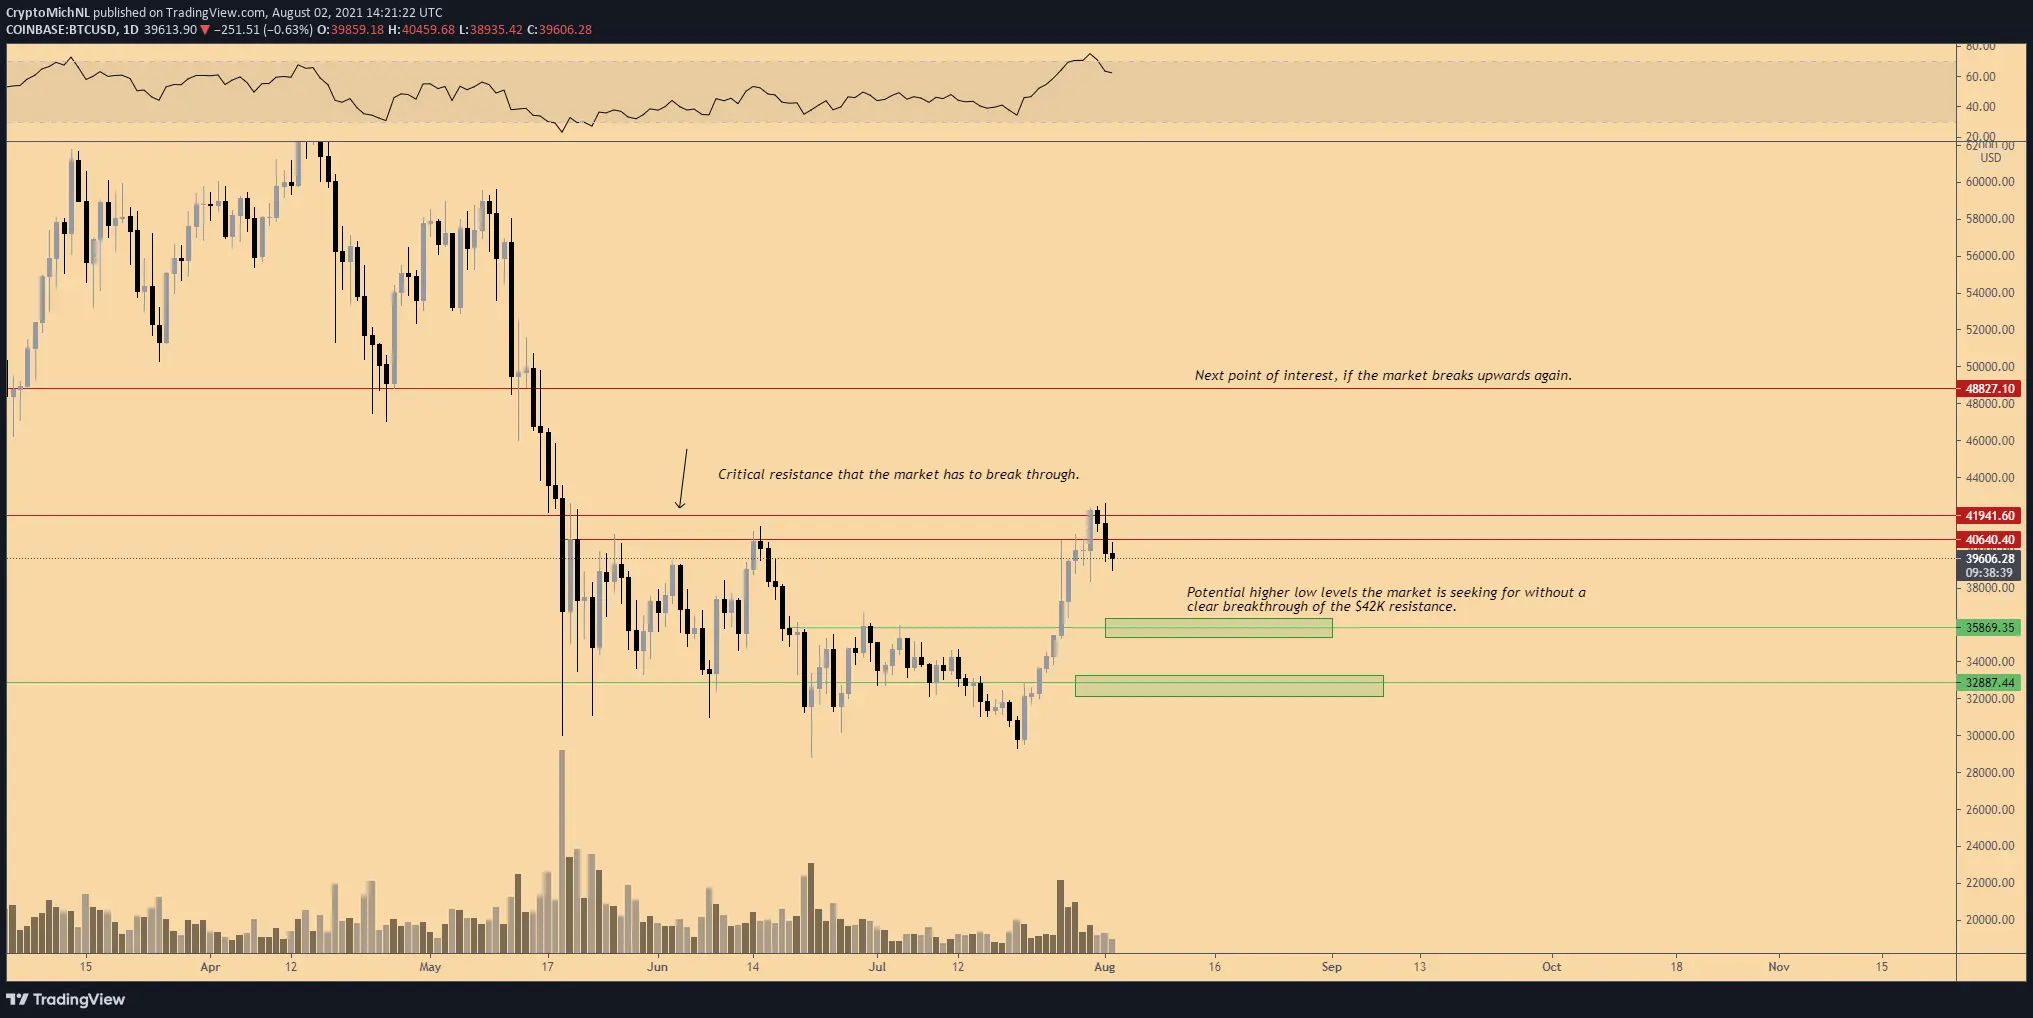
The daily chart of Bitcoin doesn’t tell us much information, even though the recent rally was a steep staircase of green candles.
This rally not only showed the interest in the market but also that the most popular projections are often wrong. Many people anticipated a further crash to $20,000 when Bitcoin’s price was hovering around $30,000. On-chain analysis shows that short-term holders have been selling heavily in that range, anticipating a further correction to be happening, while long-term holders have been accumulating heavily.
Thus, the exact opposite of a correction took place. Bitcoin rebounded by 44%, while altcoins have seen gains of 70%-150%.
Further, if Bitcoin’s price can’t break further upwards above $42,000, a potential higher low scenario can be validated in the region around $36,000 or $33,000.
However, a substantial corrective move to $33,000 would be unwelcome if the market is truly bullish as such a correction would grant an entry position to the latecomers once again.
Moreover, a correction to $36,000 would generate a higher low, which would confirm a market trend change. After a higher high, a higher low confirms a trend change and the bullish divergence, making the $36,000 scenario the optimal level for this to happen.
Total market cap also at big resistance
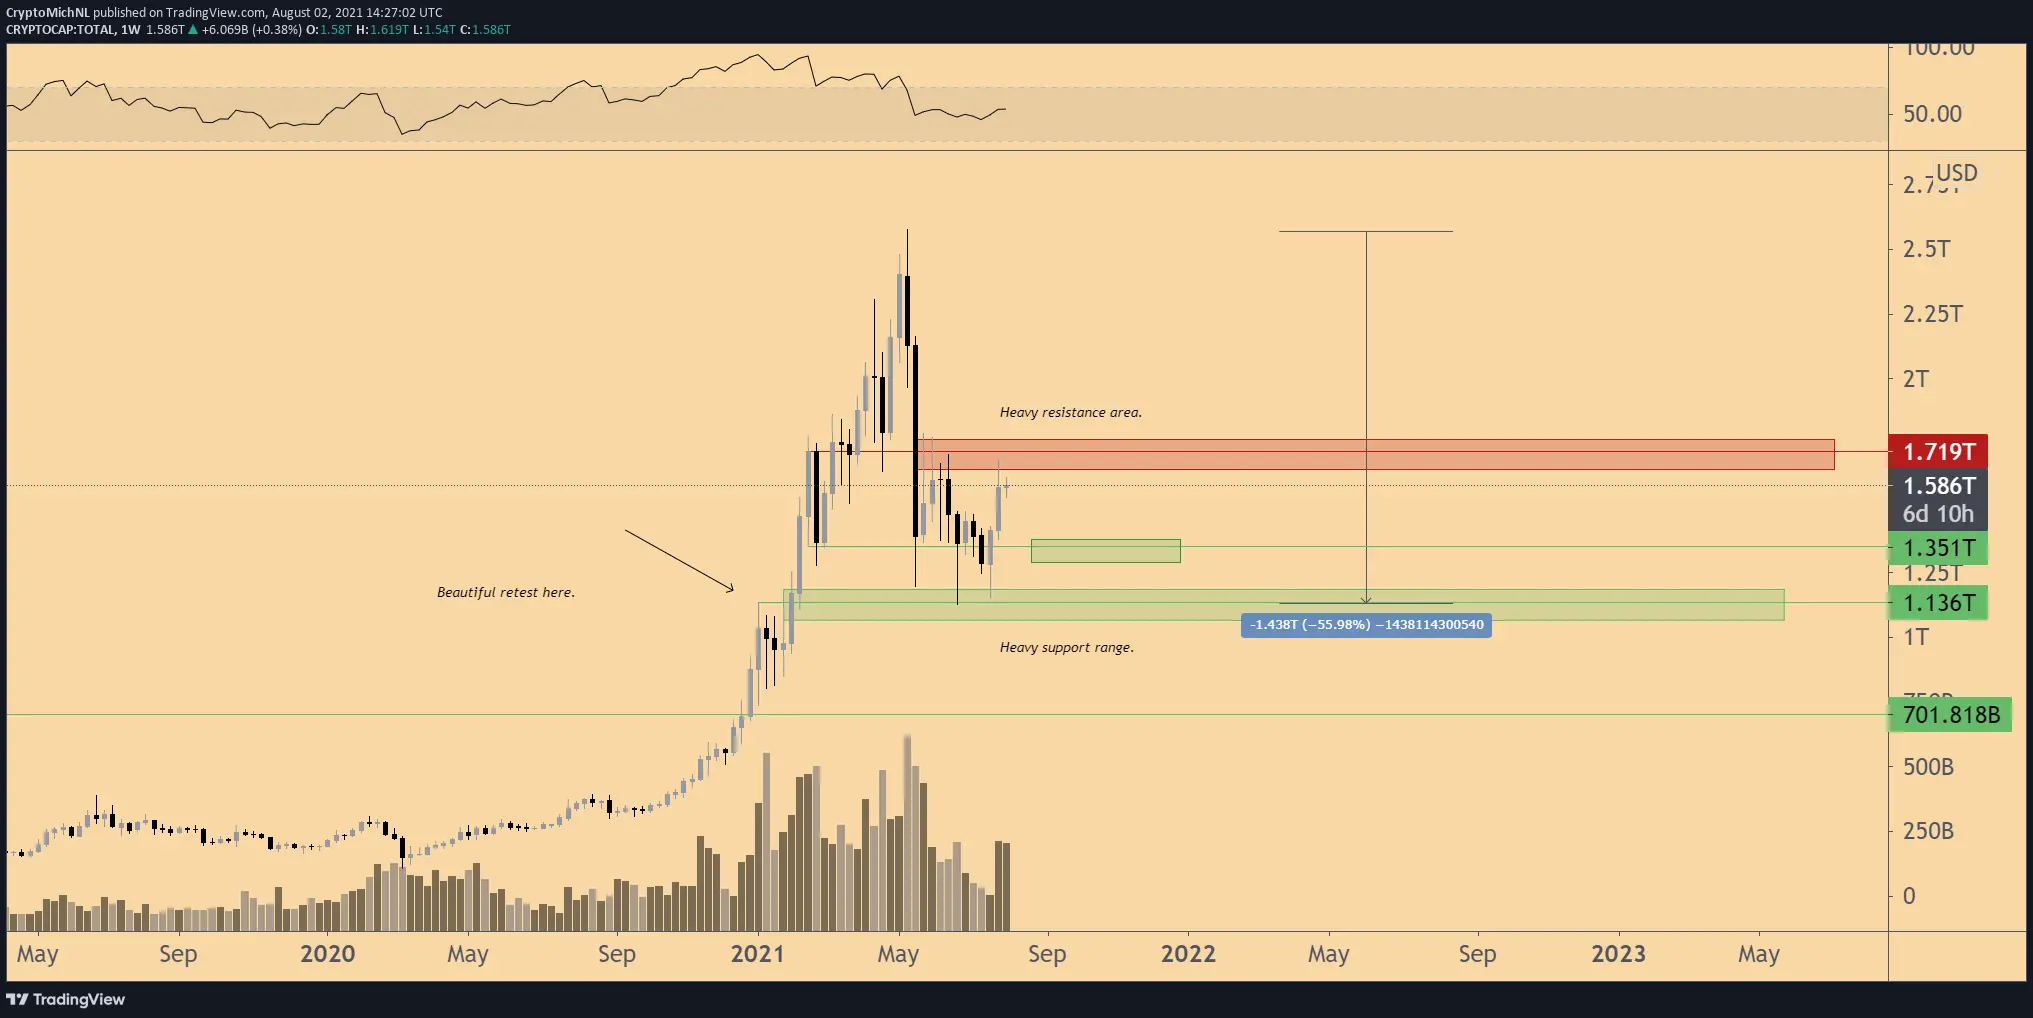
The total cryptocurrency market capitalization has seen a devastating and rapid crash by 55%, resulting in a sentiment switch from euphoria to depression.
However, looking at the chart, a healthy and beautiful retest has been made at the $1.1 trillion levels. This level wasn’t tested during the entire move-up. Now, it has finally got this retest, resulting in buyers stepping in.
This level is comparable to the $28-$31K region for Bitcoin, which has survived multiple tests. The total market cap of crypto doesn’t seem to be ready for an upward breakout, however, as it’s currently facing a critical resistance zone at $1.75 trillion.
The red zone has been showing resistance multiple times, forming a range-bound construction. In that structure, a higher low is needed to confirm a change in trend. In that regard, a higher low at $1.35 trillion would be a good level for bullish continuation. If the total market capitalization breaks above $1.75 trillion, new all-time highs become likely.
Key levels to watch for Bitcoin on lower timeframes
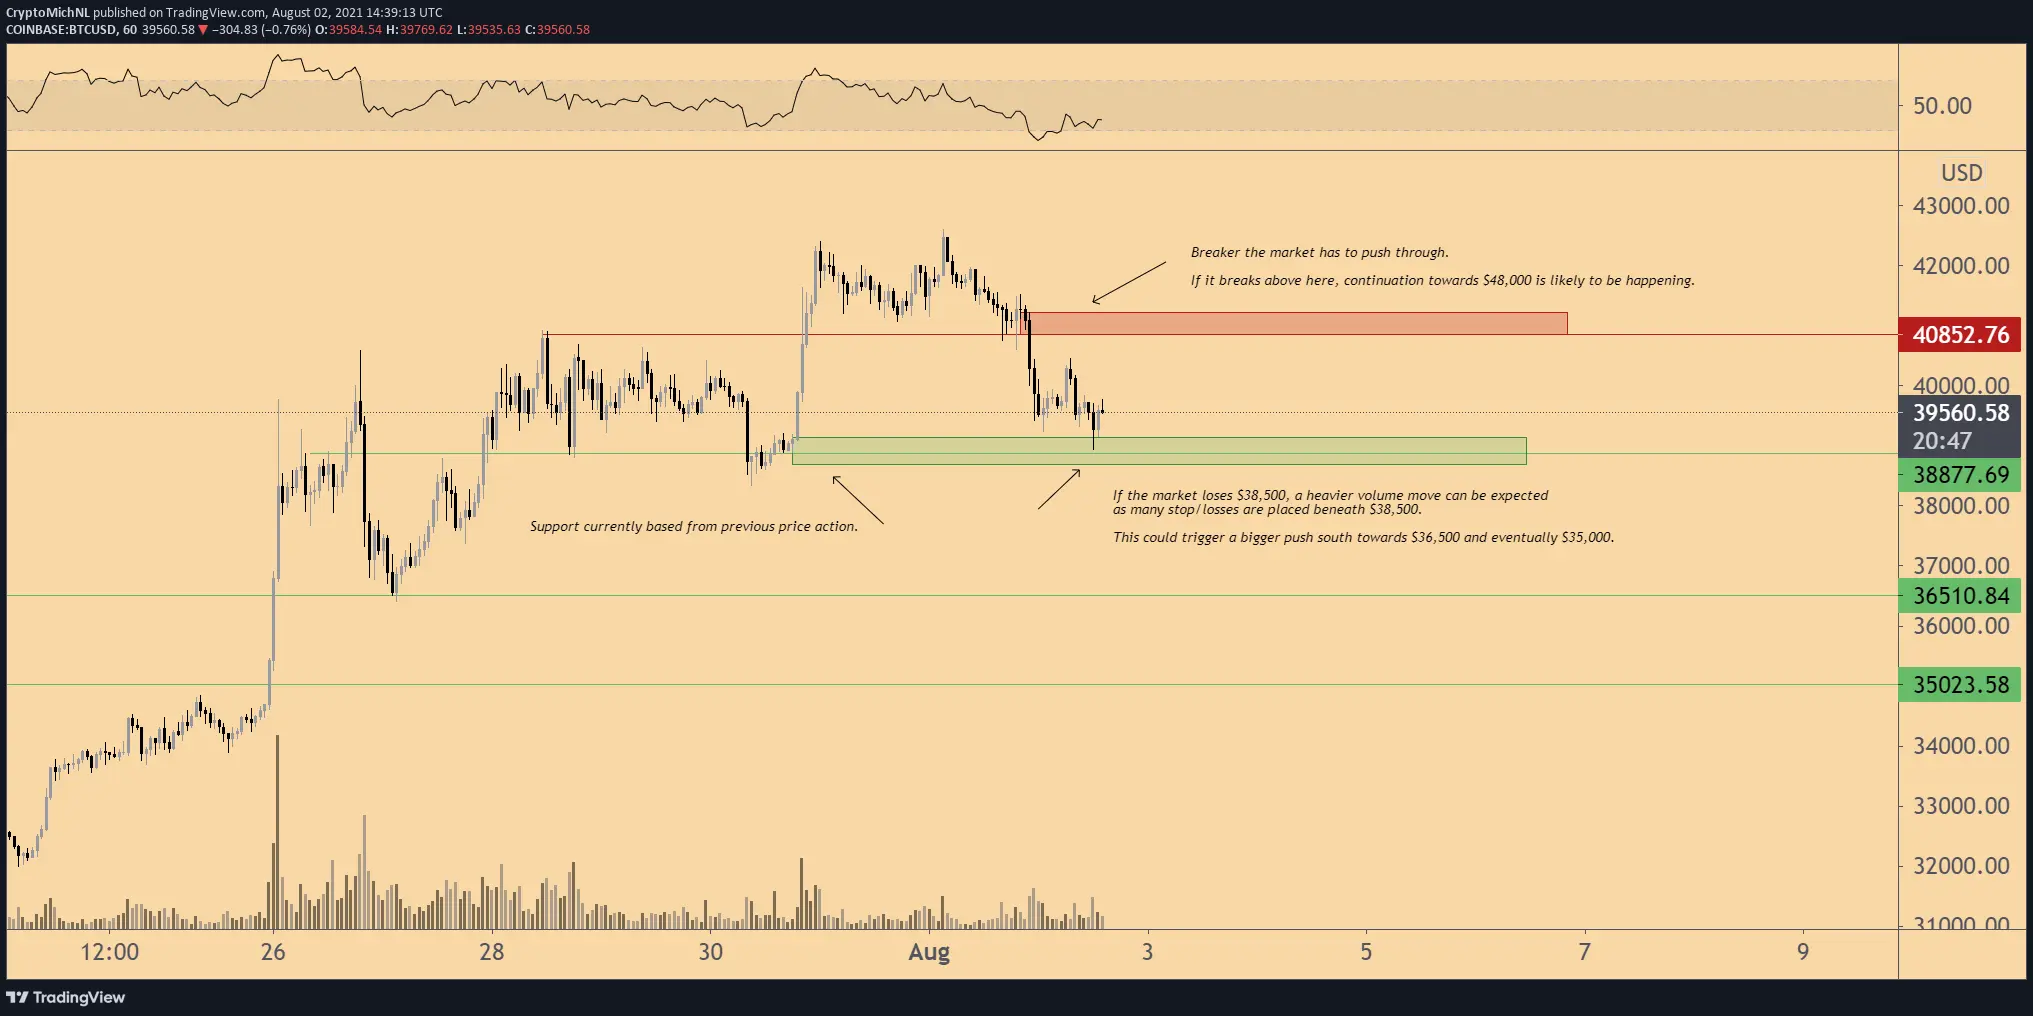
The 1-hour chart for Bitcoin shows a clear picture of the current market. On the 4-hour, a bearish divergence is spotted, which will be confirmed if the price of Bitcoin drops beneath $38,500.
With the 1-hour chart, the price of Bitcoin dropped beneath the support level at $40,800. This drop means a market breakdown has taken place, and the subsequent support had to be tested. That next support level can be found at $38,600.
The breakdown didn’t have much volume, however, as the actual stops are placed beneath the recent low at $38,500. Therefore, a heavier correction towards $36,500 and $35,000 is on the table if the market breaks down once more.
Such a correction would correct the entire market, through which Ether (ETH) could see a drop to $2,300 and $2,000 as well.
The crucial levels on the downside are found at $38,500, as well as at $36,500 and $35,000.
Finally, the crucial resistance to breaking Bitcoin’s price is found at $40,600-$41,000. If that level breaks, it’s very likely to see a continuation of the rally happening to $48,000 as the price of Bitcoin will take out the recent high at $42,000.
However, after such a substantial rally and a fast sentiment switch, a correction is very healthy, especially if Bitcoin can’t break above $40,800 in one-go.
The views and opinions expressed here are solely those of the author and do not necessarily reflect the views of Cointelegraph. Every investment and trading move involves risk. You should conduct your own research when making a decision.
Author

Cointelegraph Team
Cointelegraph
We are privileged enough to work with the best and brightest in Bitcoin.


