|

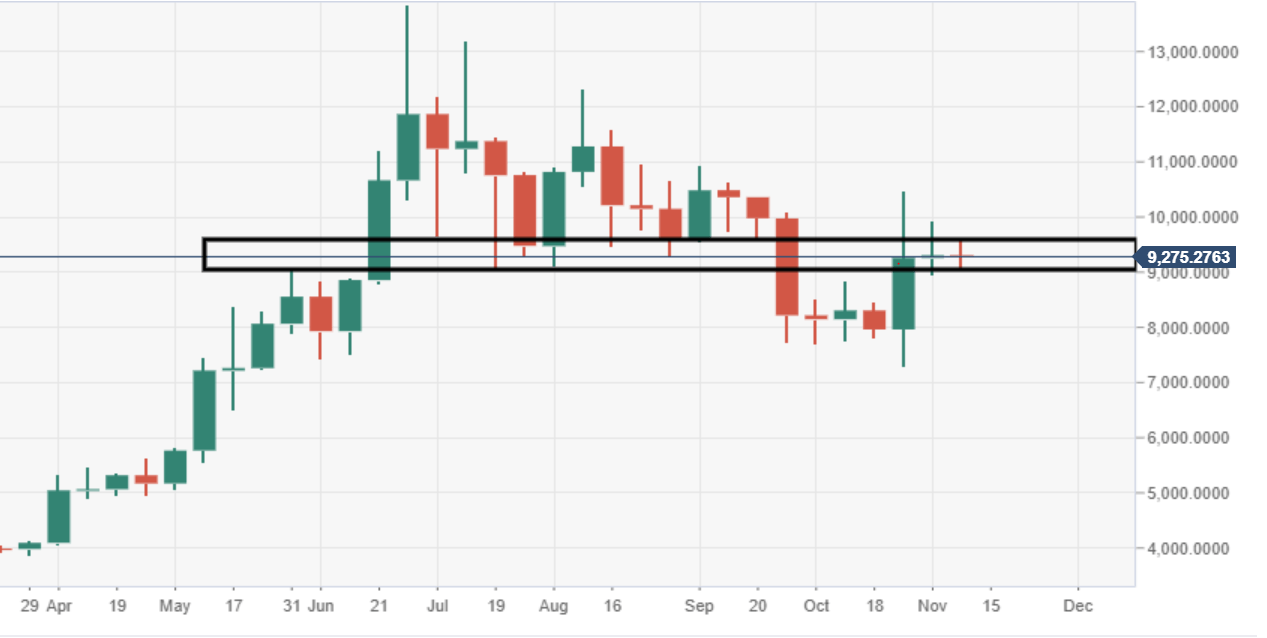
Bitcoin technical analysis: BTC/USD the big barrier of $9100 - 9500 is being tested

  • Bitcoin price is trading in negative territory, down some 1.45% in the second half of the session. 
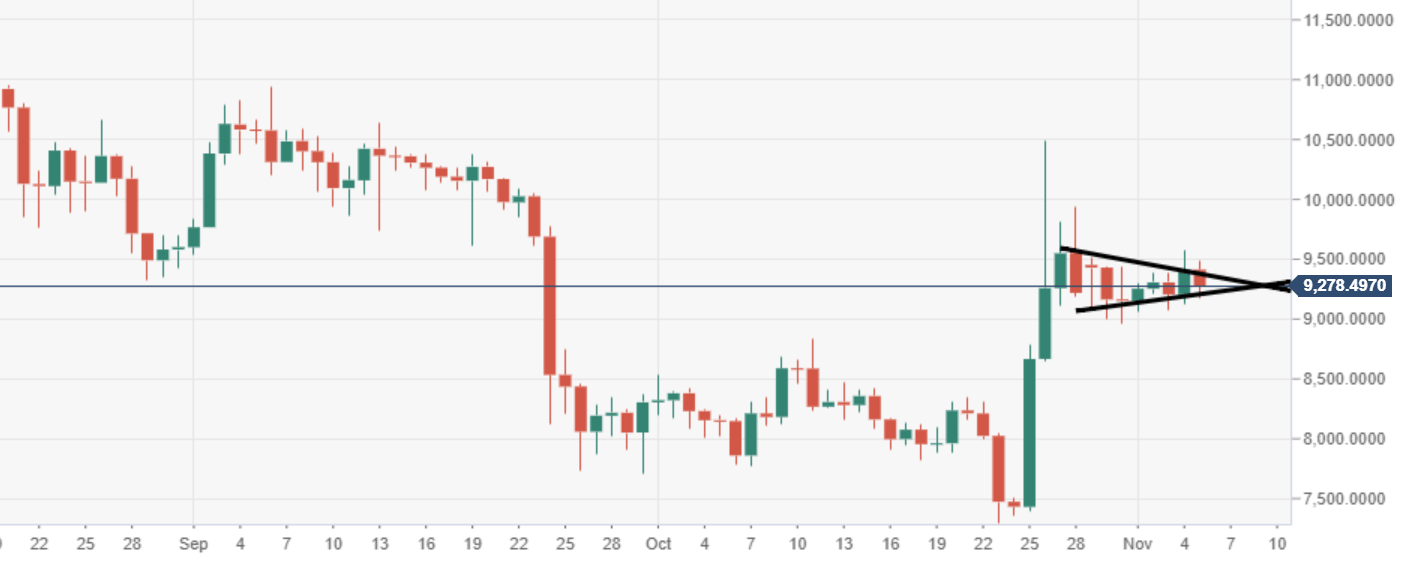
  • BTC/USD price action is further narrowing within a pennant structure, subject to a breakout. 
  • Big supply area is seen running from $9100-9500, ahead of the psychological $10,000 mark.

BTC/USD weekly chart

The region of $9000 to $9500 remains a difficult hurdle for the bulls to break down. 

BTC/USD daily chart

BTC/USD price action via the daily chart view continues to narrow within a bullish pennant, subject to a breakout. 

Spot rate:                   9,277.10

Relative change:       -1.40%

High:                          9,487.54

Low:                           9,176.08

BTC/USD

Overview
Today last price9260.67
Today Daily Change-152.24
Today Daily Change %-1.62
Today daily open9412.91
 
Trends
Daily SMA208594.87
Daily SMA508732.43
Daily SMA1009592.86
Daily SMA2009070.94
 
Levels
Previous Daily High9580.19
Previous Daily Low9127.4
Previous Weekly High9938.64
Previous Weekly Low8964.78
Previous Monthly High10484.7
Previous Monthly Low7300.54
Daily Fibonacci 38.2%9407.22
Daily Fibonacci 61.8%9300.37
Daily Pivot Point S19166.81
Daily Pivot Point S28920.72
Daily Pivot Point S38714.03
Daily Pivot Point R19619.6
Daily Pivot Point R29826.29
Daily Pivot Point R310072.38

Author

Ken Chigbo

Ken Chigbo

Independent Analyst

Ken has over 8 years exposure to the financial markets. He started his career as an analyst, covering a variety of asset classes; forex, fixed income, commodities and equities.

More from Ken Chigbo
Share:

Editor's Picks

Crypto's future lies in tokenized real-world assets, not speculation

Atlas Capital CEO Reza Bandi stated that the crypto industry's next major growth phase will be driven by the tokenization of real-world assets rather than speculative trading. In an interview with FXStreet, Bandi identified three factors supporting the expansion of tokenization.

Top 3 Price Prediction: BTC remains vulnerable, ETH weakens further, XRP signals more downside

Bitcoin, Ethereum, and Ripple remain under pressure mid-week, as the broader cryptocurrency market struggles to regain recovery momentum. BTC struggles below $62,000, ETH continues to weaken below $1,650, while XRP’s momentum indicators remain biased toward further downside.

Crypto Overview: Bitcoin is back under $62,000 – Hyperliquid, DeXe lead losses

The broader cryptocurrency market is under pressure with Bitcoin slipping below $62,000 amid the US launching its third wave of strikes on Iran. Hyperliquid and DeXe are leading losses over the last 24 hours, risking the prevailing upward trend.

Bitcoin sell-off pushes over 50% of circulating supply into loss, hinting at market bottom
Bitcoin (BTC) dropped near $61,000 on Tuesday, with the latest sell-off pushing long-term market indicators toward levels historically associated with bear-market bottoms, according to a report by K33 Research.
Bitcoin: After the bloodbath, everyone looks at $60,000
Bitcoin (BTC) hovers above $62,000 at the time of writing on Friday, weighed down by growing risk-off sentiment due to persistent geopolitical tensions in the Middle East and sticky macroeconomic uncertainty. The institutional sell-off continued to wreak havoc on capital flows, with spot Bitcoin Exchange-Traded Funds (ETFs) recording billions in outflows.