Bitcoin Technical Analysis: BTC/USD is heading towards a catastrophic daily closure below vital ascending trend line
- Bitcoin sees large volatility on Thursday, smashed by the bears, down over 5%.
- BTC/USD heading towards a big daily closure below vital ascending trend line.

BTC/USD 15-minute chart
- After the deep fall the early part of Thursday, price action is consolidating, but not out of danger yet.
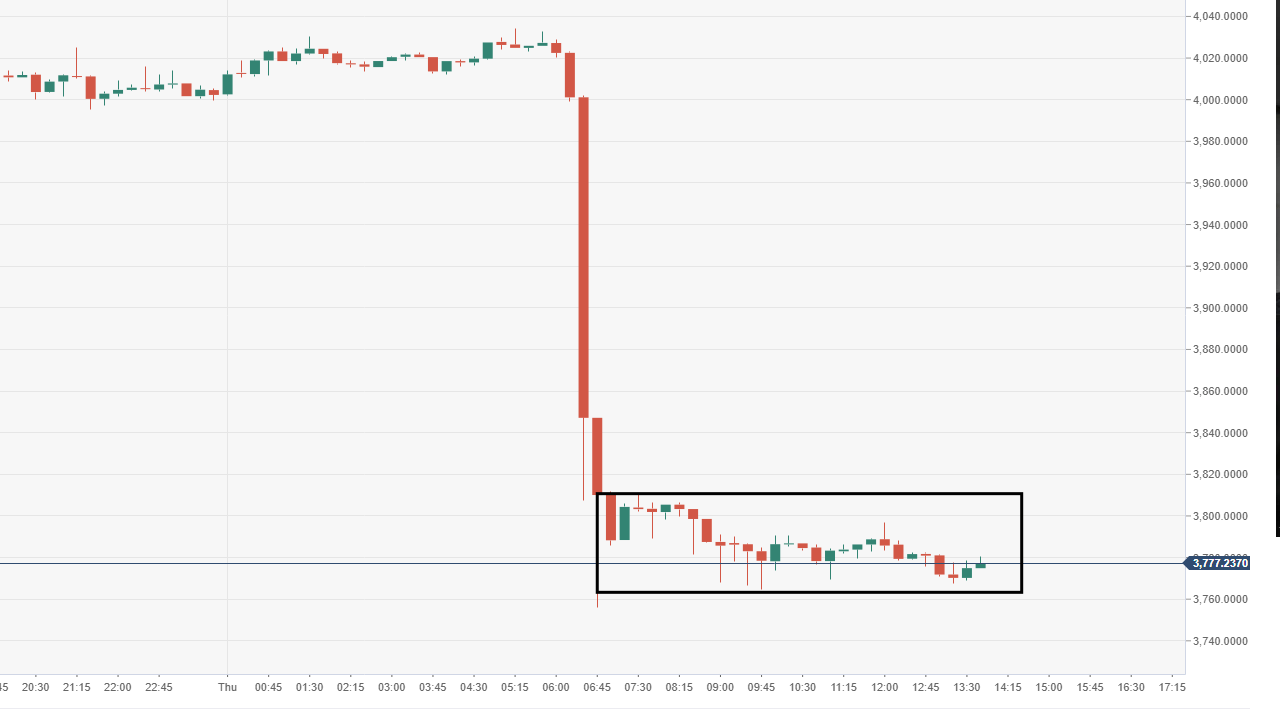
Spot rate: 3775.16
Relative change: -5.40%
High: 4034.23
Low: 3756.2
Trend: Neutral
Support 1: 3961.93, daily pivot point support.
Support 2: 3921.56, daily pivot point support.
Support 3: 3880.76, daily pivot point support.
Resistance 1: 4043.09, daily pivot point resistance.
Resistance 2: 4083.89, daily pivot point resistance.
Resistance 3: 4124.25, daily pivot point resistance.
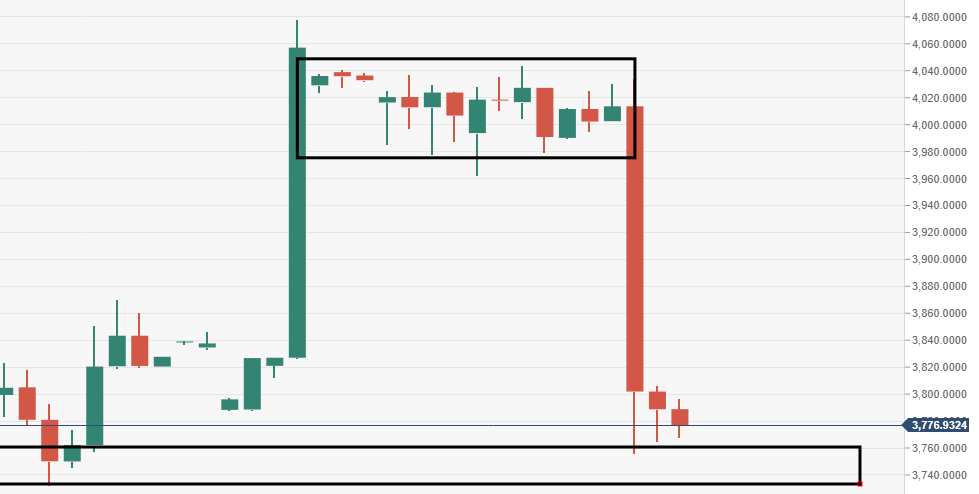
BTC/USD 4-hour chart
- Price action has initially been ranging between 6-10 December, which made it vulnerable to an explosive move, given the mentioned price behavior.
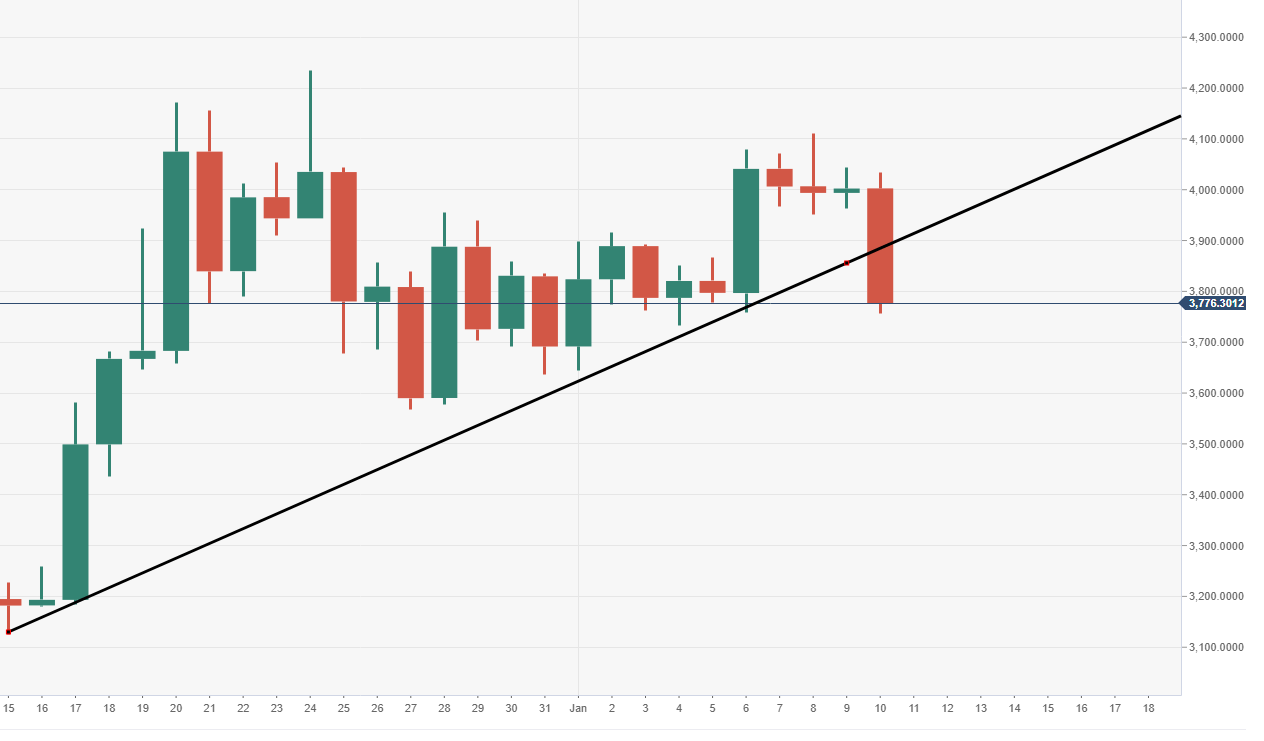
BTC/USD daily chart
- An ascending trend line that has been running since 15th December, has seen the current daily candle breach this. A closure below could be catastrophic.
Author

Ken Chigbo
Independent Analyst
Ken has over 8 years exposure to the financial markets. He started his career as an analyst, covering a variety of asset classes; forex, fixed income, commodities and equities.


