Bitcoin Technical Analysis: BTC/USD enjoyed an extended breakout to the upside from a bull flag, $8000 in sights
- Bitcoin price seen up a healthily over 4% on Monday, as it extends recent run.
- BTC/USD broke out to the upside from a bull flag pattern, that was initially containing the north momentum.
- In just over a week now, Bitcoin has gained over 25%.

BTC/USD 60-minute chart
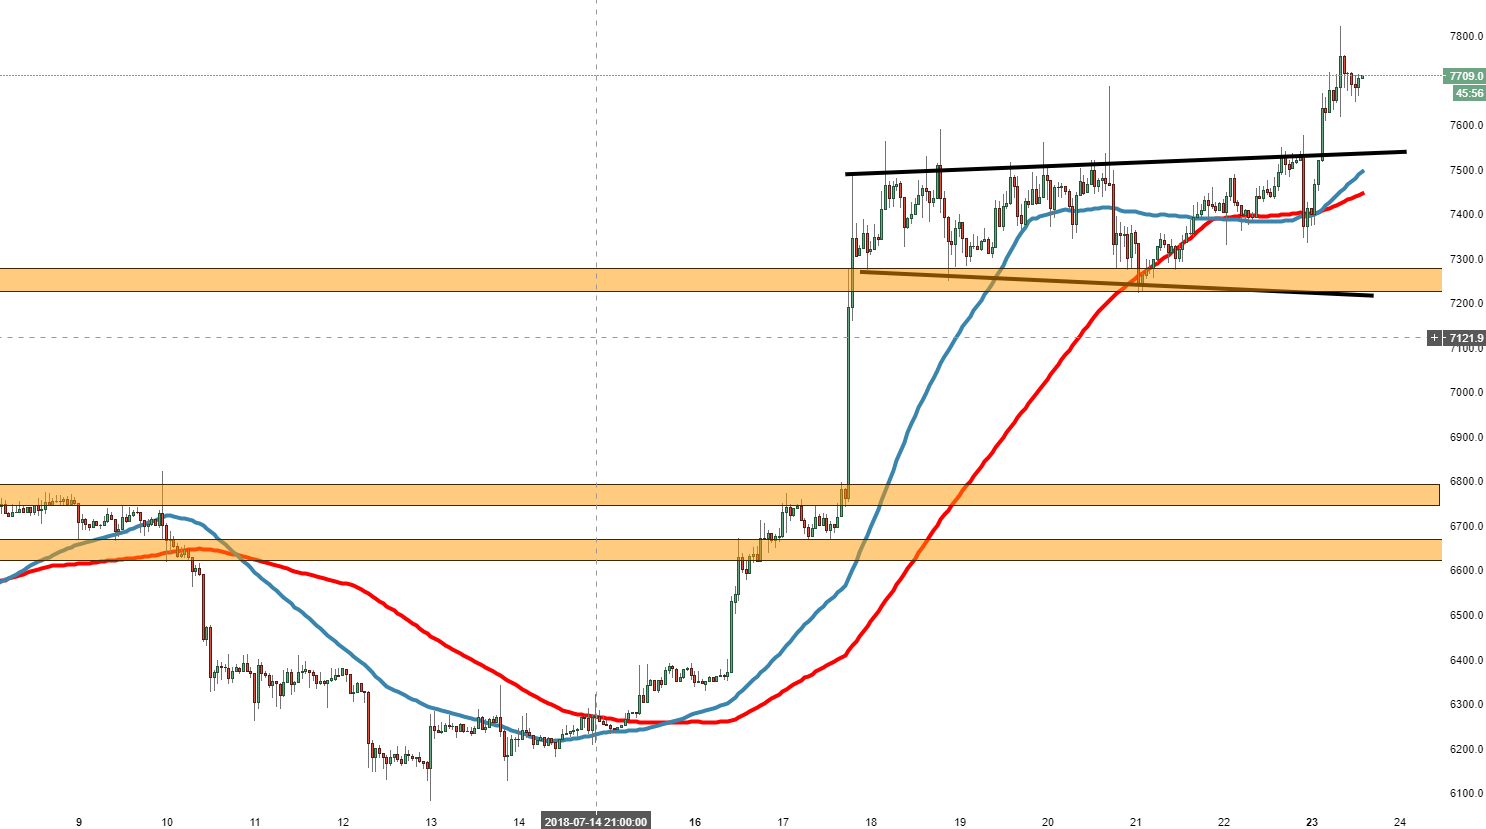
Spot rate: 7701.0
Relative change: +4.09%
High: 7820.0
Low: 7374.0
Trend: Bullish
Support 1: 7655.0, (support on 60-minute chart).
.
Support 2: 7534.2, On top of bull flag pattern.
Support 3: 7499.8, 50MA.
Resistance 1: 7751.8, (resistance on 60-minute chart).
Resistance 2: 7820.0, today's (Monday) high.
Resistance 3: 8000.0, psychological resistance.
Author

Ken Chigbo
Independent Analyst
Ken has over 8 years exposure to the financial markets. He started his career as an analyst, covering a variety of asset classes; forex, fixed income, commodities and equities.


