Bitcoin technical analysis: BTC/USD bears have forced a devastating daily closure below flag pattern
- Bitcoin price is trading in minor positive territory, up some 0.35% in the second half of the session.
- BTC/USD price action broke out and closed below a bearish flag via the daily chart view.
- The next major daily support is eyed at psychological $7000 down to $6800 range.

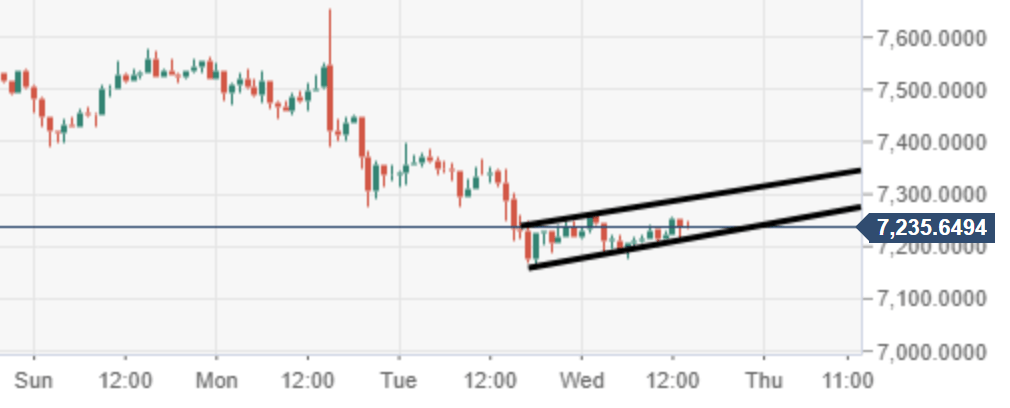
BTC/USD 60-minute chart
Price action is moving within a near-term bearish flag structure, to suggest another break south may be around the corner.
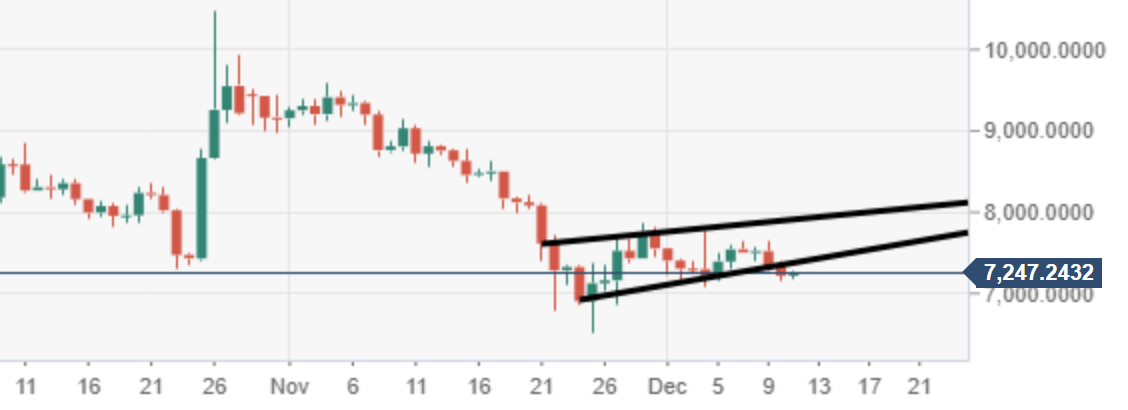
BTC/USD daily chart
The price is trading just below a bearish flag structure, which leaves it vulnerable to further potential downside for now.
Spot rate: 7,387.68
Relative change: +0.35%
High: 7266.01
Low: 7177.92
Author

Ken Chigbo
Independent Analyst
Ken has over 8 years exposure to the financial markets. He started his career as an analyst, covering a variety of asset classes; forex, fixed income, commodities and equities.
More from Ken Chigbo


