Bitcoin Technical Analysis: BTC/USD bears hammered through vital near-term ascending trend line
- Bitcoin price is trading down over 2% into the second half of Monday's session.
- BTC/USD bears managed to force a devastating breach of a near-term key support.

BTC/USD 15-minute chart
- Price action smashed through a key near-term supporting ascending trend line.
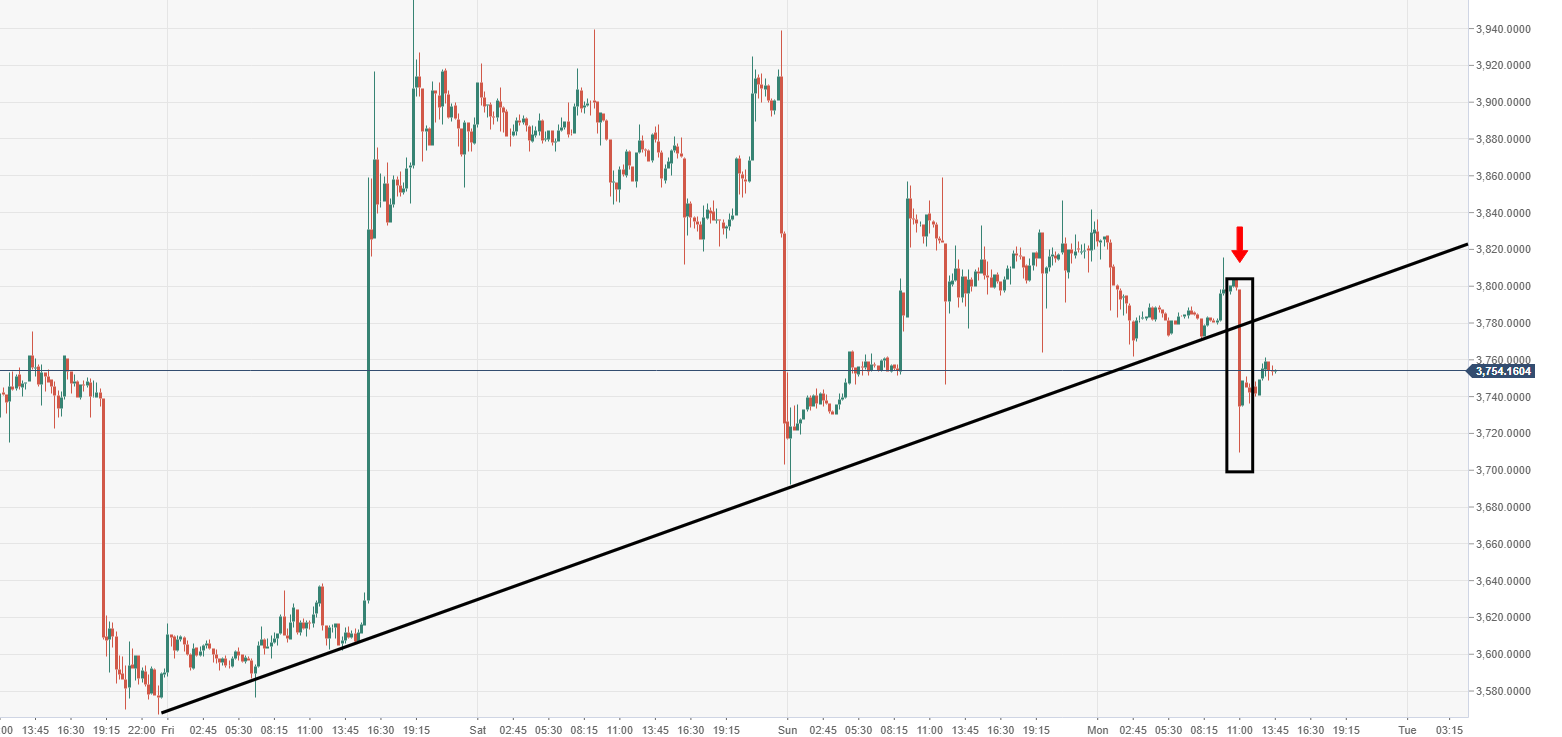
Spot rate: 3752.12
Relative change: -2.27%
High: 3836.05
Low: 3709.61
Trend: Bearish
Support 1: 3729.00, daily pivot point support.
Support 2: 3627.29, daily pivot point support.
Support 3: 3562.16, daily pivot point support.
Resistance 1: 3895.84, daily pivot point resistance.
Resistance 2: 3960.97, daily pivot point resistance.
Resistance 3: 4062.68, daily pivot point resistance.
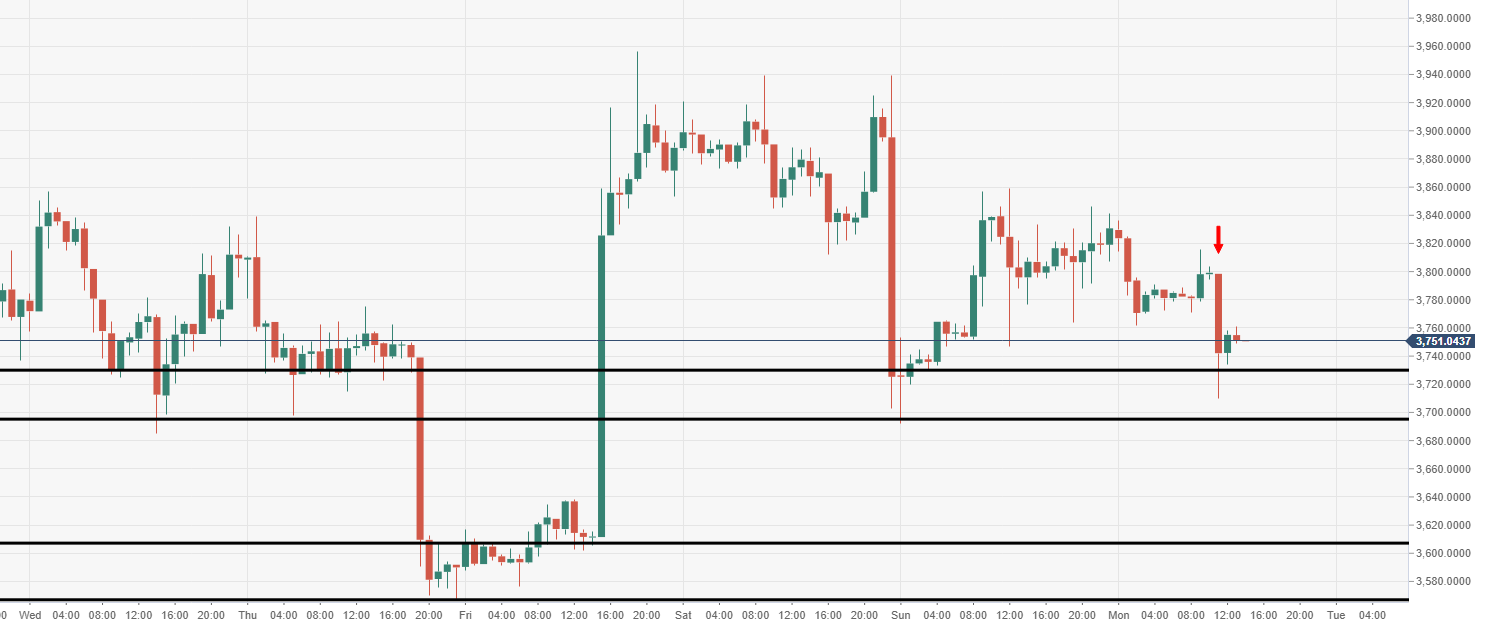
BTC/USD 60-minute chart
- Price forced to seek comfort in demand zone, tracks from $3700-3750, a failure to hold could see $3500 retested to the downside.
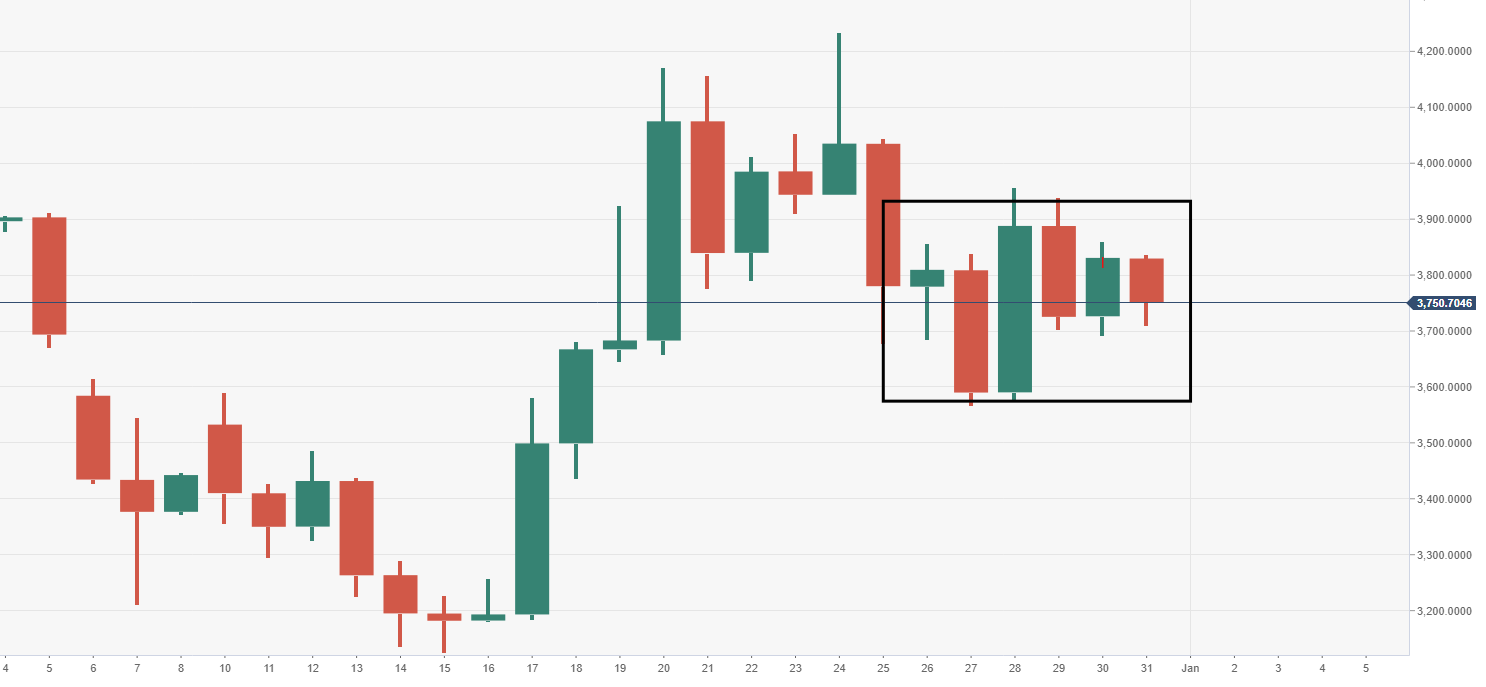
BTC/USD daily chart
- The price really has not done much since 26th December, trading within this range block.
Author

Ken Chigbo
Independent Analyst
Ken has over 8 years exposure to the financial markets. He started his career as an analyst, covering a variety of asset classes; forex, fixed income, commodities and equities.


