Bitcoin Technical Analysis: BTC/USD another day same range
- Bitcoin price is trading in minor negative territory, down just some 0.10% on Wednesday.
- BTC/USD is stuck within a very stubborn range-block formation, as seen via the daily time frame.

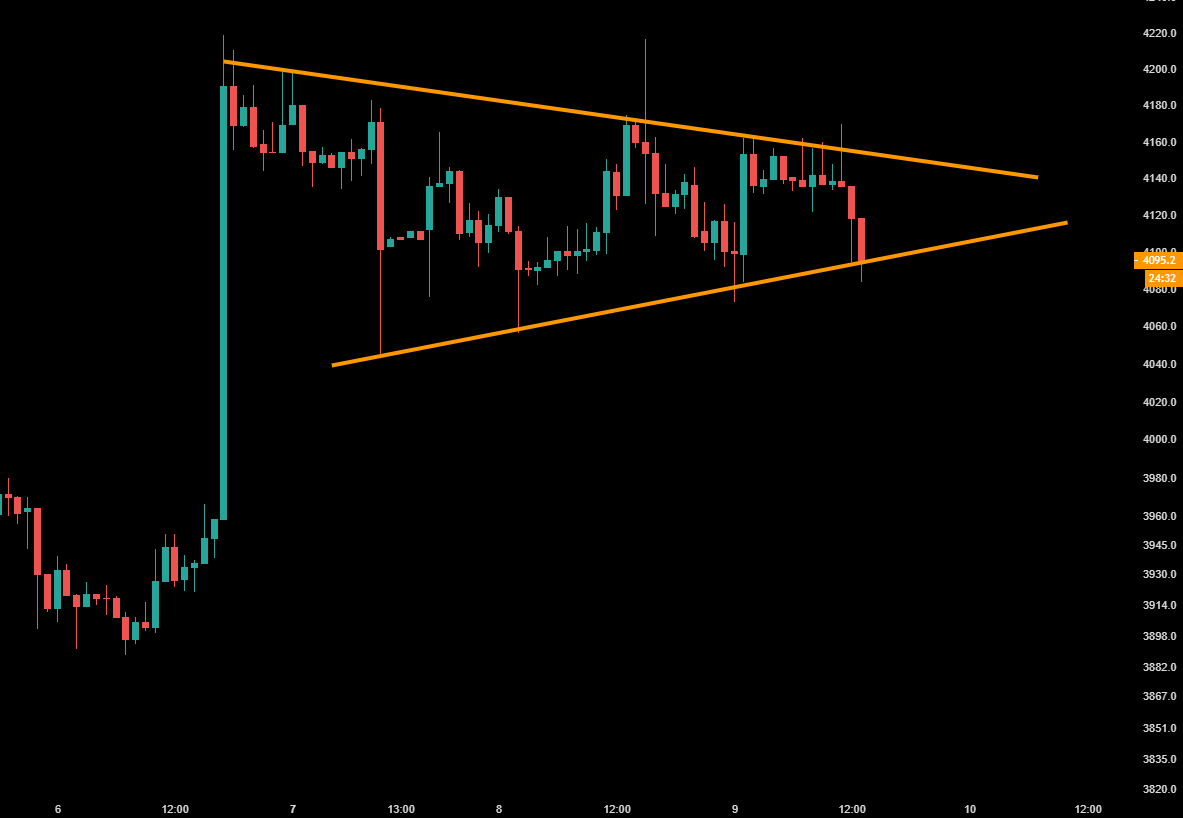
BTC/USD 15-minute chart
- BTC/USD is generally respecting the confinements of a near-term wedge.
Spot rate: 4095.2
Relative change: +0.12%
High: 4168.9
Low: 4072.7
Trend: Neutral
Support 1: 3926.66, daily pivot point support.
Support 2: 3859.59, daily pivot point support.
Support 3: 3767.57, daily pivot point support.
Resistance 1: 4085.76, daily pivot point resistance.
Resistance 2: 4177.78, daily pivot point resistance.
Resistance 3: 4244.86, daily pivot point resistance.
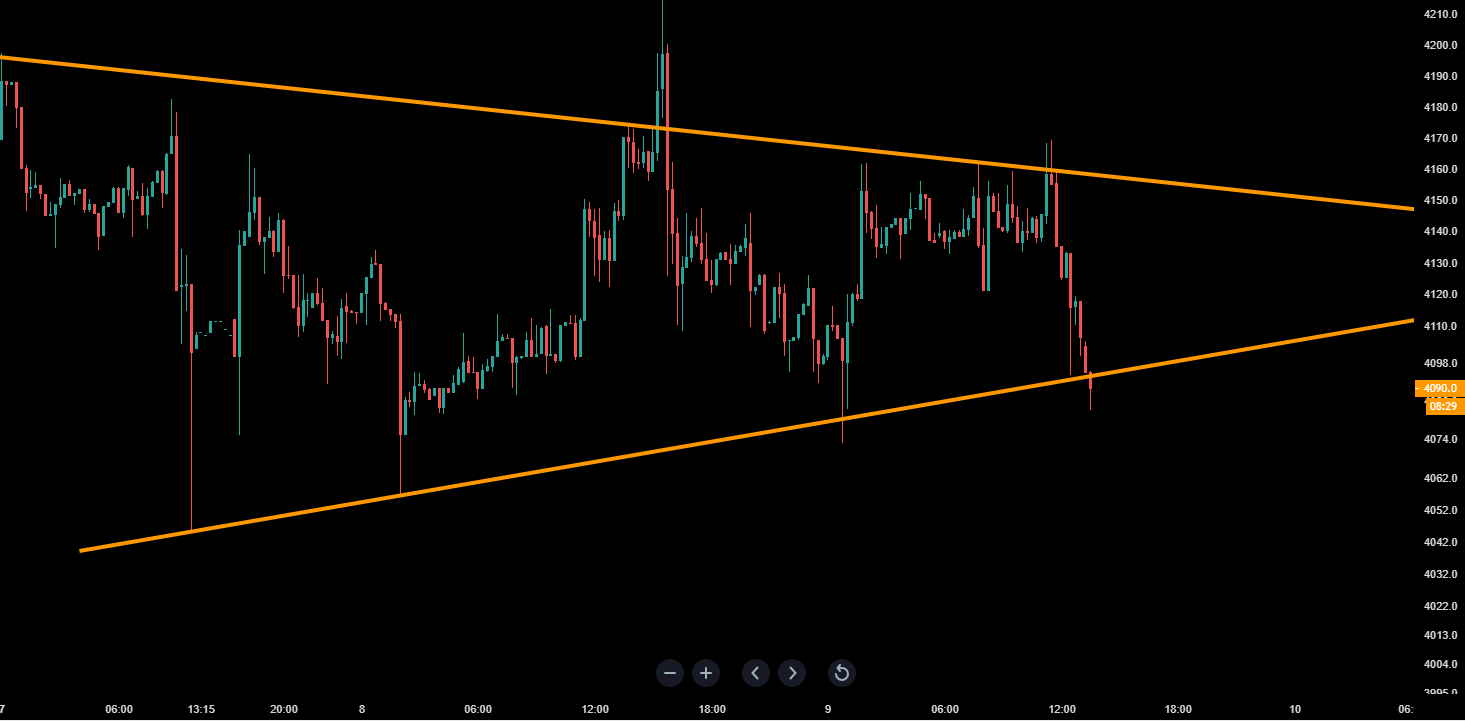
BTC/USD 60-minute chart
- Price action via the 60-minute view is moving within a horizontal wedge formation.
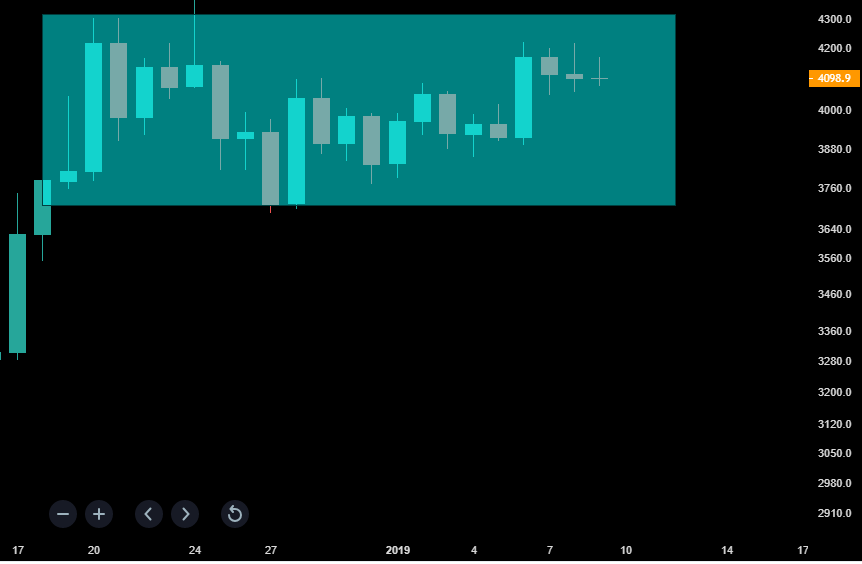
BTC/USD 4-hour chart
- Another day the price remains firmly within the constraints of a range-block formation.
Author

Ken Chigbo
Independent Analyst
Ken has over 8 years exposure to the financial markets. He started his career as an analyst, covering a variety of asset classes; forex, fixed income, commodities and equities.


