Bitcoin Technical Analysis: BTC/USD a break above $4000 is the key to the heavens
- Bitcoin price on Friday is holding very modest gains of some 0.6% in the second half of the session.
- BTC/USD continues to flirt with the big $4000 price area, where much resistance near-term is eyed.

Spot rate: 3930.40
Relative change: +0.60%
High: 3954.53
Low: 3884.74
Trend: Neutral
Trends:
Daily SMA20: 3578.24
Daily SMA50: 3620.35
Daily SMA100: 3932.26
Daily SMA200: 5239.41
Levels:
Previous Daily High: 3965.83
Previous Daily Low: 3866.13
Previous Weekly High: 3655.36
Previous Weekly Low: 3536.68
Previous Monthly High: 4110.71
Previous Monthly Low: 3341.58
Daily Fibonacci 38.2%: 3927.74
Daily Fibonacci 61.8%: 3904.21
Daily Pivot Point S1: 3881.46
Daily Pivot Point S2: 3823.94
Daily Pivot Point S3: 3781.76
Daily Pivot Point R1: 3981.16
Daily Pivot Point R2: 4023.35
Daily Pivot Point R3: 4080.87
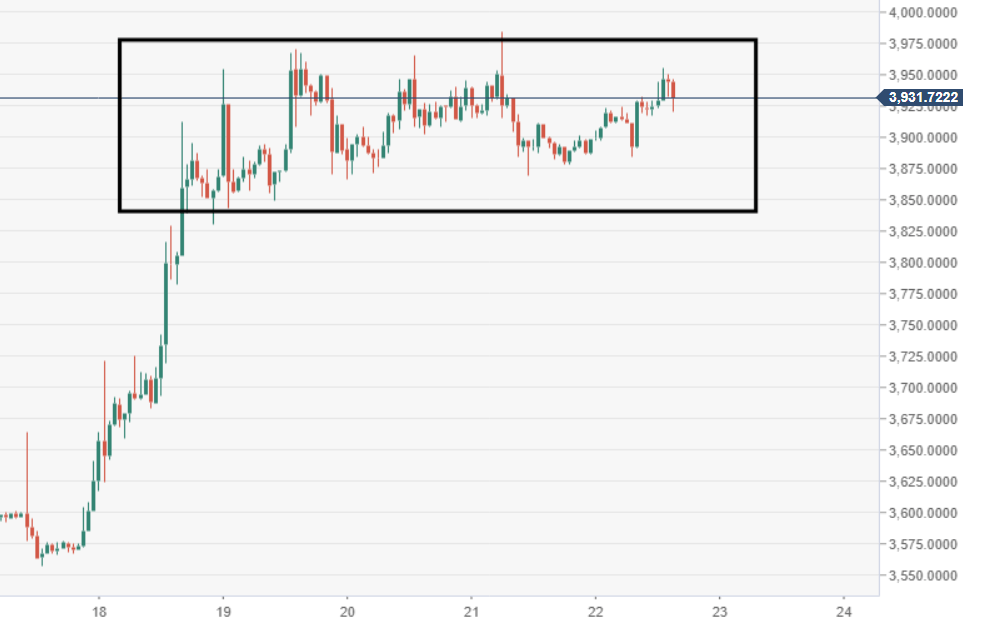
BTC/USD 60-minute chart
- The price has found itself range-trading once again, within $3850-3975 area.
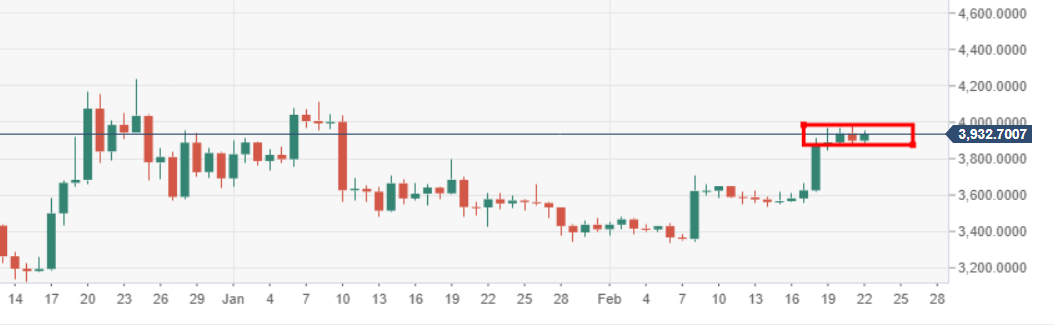
BTC/USD daily chart
- Remains somewhat elevated but unable to firmly breakthrough the $4000 price mark.
Author

Ken Chigbo
Independent Analyst
Ken has over 8 years exposure to the financial markets. He started his career as an analyst, covering a variety of asset classes; forex, fixed income, commodities and equities.


