Bitcoin struggling to break 78.6% fib in triangle

Bitcoin (BTC/USD) has made a critical bullish breakout above the key long-term resistance trend line. But is price action really in a full uptrend? Or will price bounce at the Fibonacci resistance?
Price Charts and Technical Analysis
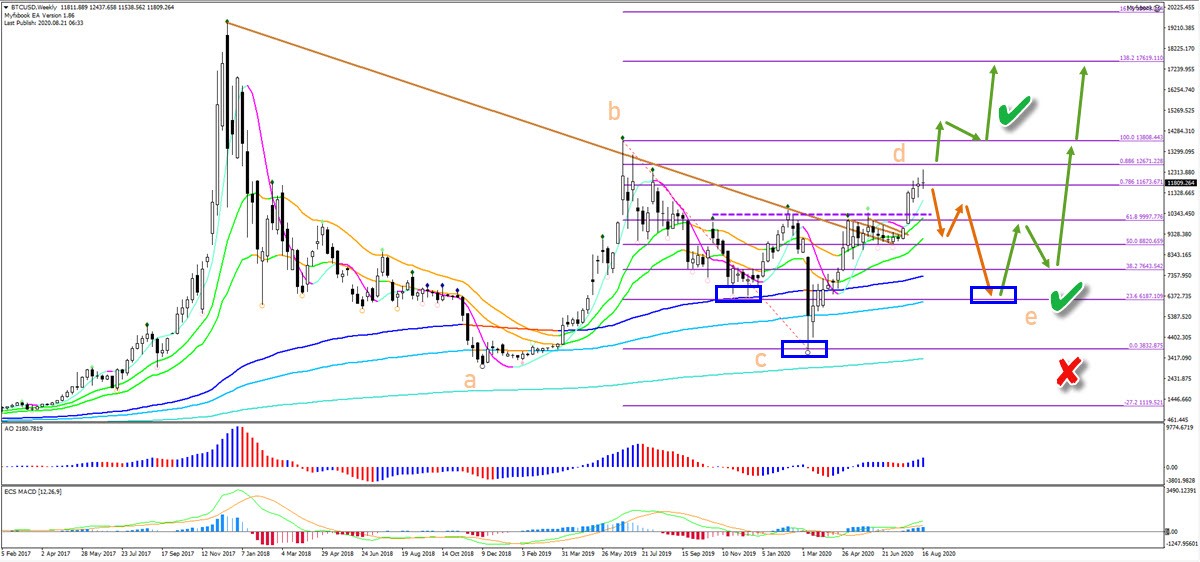
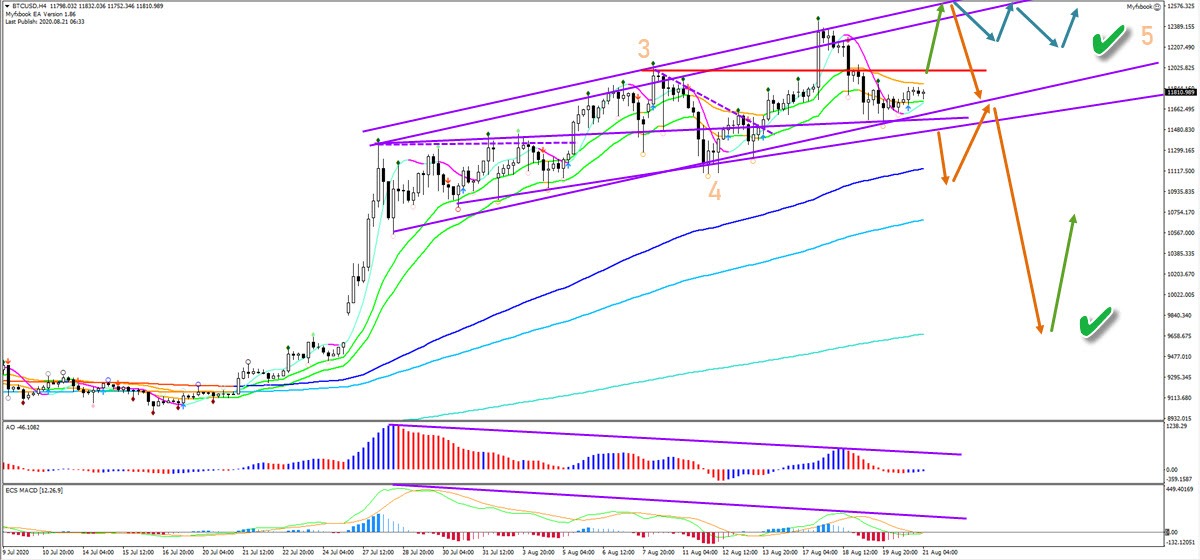
The BTC/USD is facing deep and heavy Fibonacci retracement levels. Currently a bearish bounce seems to be the most likely scenario. A failure to move higher could start a bearish ABC pattern, which confirms a larger ABCDE (orange) triangle pattern. In that case, the inverted head and shoulders pattern (blue boxes) are expected to act as support and would end the triangle formation and should restart a strong uptrend.
The alternative is an immediate bullish breakout above the top of wave B. Such a breakout would invalidate the triangle pattern and confirm the uptrend. In that case, price action is ready for testing the previous top. Only a breakout below the bottom of wave C invalidates the bullish outlook.
The analysis has been done with the ecs.SWAT method and ebook.
Author

Chris Svorcik
Elite CurrenSea
Experience Chris Svorcik has co-founded Elite CurrenSea in 2014 together with Nenad Kerkez, aka Tarantula FX. Chris is a technical analyst, wave analyst, trader, writer, educator, webinar speaker, and seminar speaker of the financial markets.


