Bitcoin-SPX correlation could jeopardize bitcoin’s rebound: Technical Tuesday

In brief
The cryptocurrency markets were mostly in the green on Tuesday, as BTC prices gradually bounced back to USD 9100 levels.
Data shows that the correlation between BTC and SPX has been increasing again, which could be a renewed concern for crypto traders.
DeFi tokens have seen notable prices actions with KNC jumped more than 8%.
Market overview
The cryptocurrency markets were recovering very slowly on Tuesday Asia after the prices of BTC briefly touched $8800 levels over the weekend. BTC prices rebounded to $9100 area in the early session. However, the volume was noticeably lower. The rebound also brought BTC back to the trading range, where it has been traded for the past month.
The correlations between the SPX and BTC could be a renewed concern for traders. Data from The Block Research shows that the relationship between the two has returned to March levels at around 0.31. While the reading is still relatively low compared to April's levels, the increasing number of new COVID cases in key US states has been a growing concern for the equity markets. A COVID-led correction in the SPX could quickly ripple through the cryptocurrency markets.
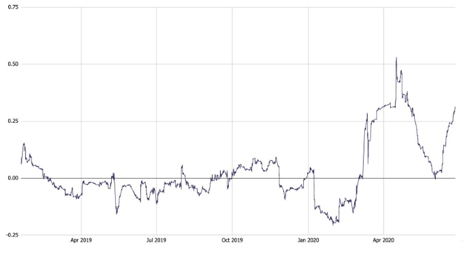
Source: The Block Research
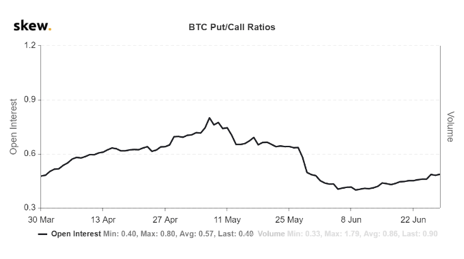
Source: Skew
On the other hand, BTC options markets seem to show the sentiment with a biasslightly toward the positive side. Data from Skew indicates that the BTC Put/Call Ratio has remained in the area between 0.40 to 0.49 in June, meaning that less than half of thetotal options open interest were inputs. Although the ratio has been gradually increasing, the current reading is still significantly lower than pre-/post-halving periods. It’s worth noting that the ratio alone doesn’t show the whole picture of the options markets, learn more about other options trading data here.
Elsewhere, the altcoin space was a mixed market on Tuesday, with BSV and DOGE were slightly in the red, while ETH and LTC gained about 1%. DeFi tokens have seen some significant price actions, with KNC surged more than 8% on the news of thetoken has been added as a collateral option on Maker’s DAI loan platform. MKR also rose more than 2%.
Price Analysis
BTCUSDT – 50MA to watch for bulls
In our last edition of Technical Tuesday, we highlighted the likelihood of BTCUSDT revisiting the one-year resistance-turned-support trendline near 8850. The support in that area is now reconfirmed.
The positive momentum has slightly picked up with the stochastic produced a bullish crossover. However, the RSI remained relatively flat, signaling the bulls still not fully takeover yet.
Although the one-year trendline support is reconfirmed, the price is still below the support of the previous triangle pattern.
The 50-day moving average near 9400 is key to watch for BTC bulls. The regain of such levels could lay the foundations for making a real trend reversal, allowing the price to retest the 10000 levels.
The one-year resistance-turned-support trendline from 8700 to 8800 could be the lower level to watch.
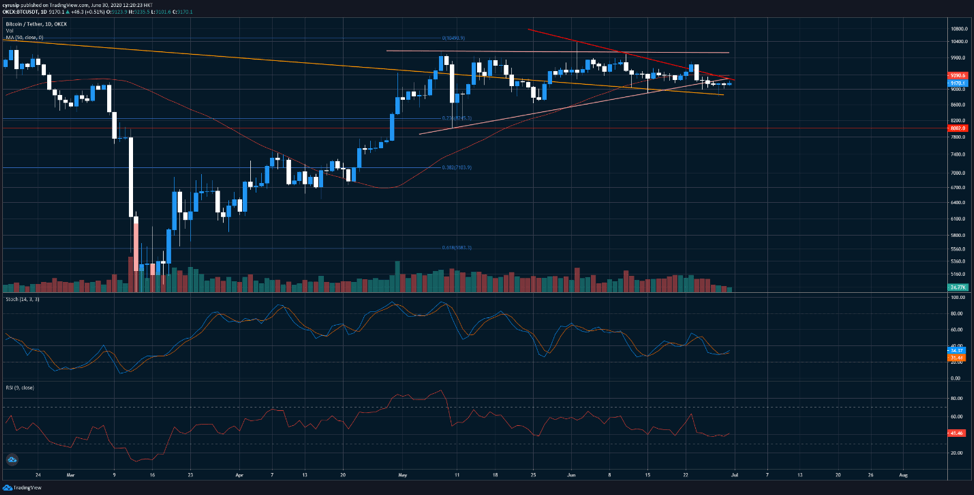
Source: OKEx; Tradingview
ETHUSDT – Bears in firm grip?
ETHUSDT retreated to the 78.6% Fibonacci retracement near 223, support at such levels seems initially confirmed, but that doesn’t mean a reversal will be seen from here.
Momentum indicators show that ETH bears remained in control, with the OBV remained in the recent downward channel, and the MACD was not likely to produce a bullish crossover in the short-term.
Although a bullish crossover seems in the making inthe stochastic, there's not enough evidence to show that a trend reversal could happen.
The bottom support of the previous triangle pattern near 238 to 240 is now likely to become resistance levels. Sunday’s low at 215 could be another level to watch.
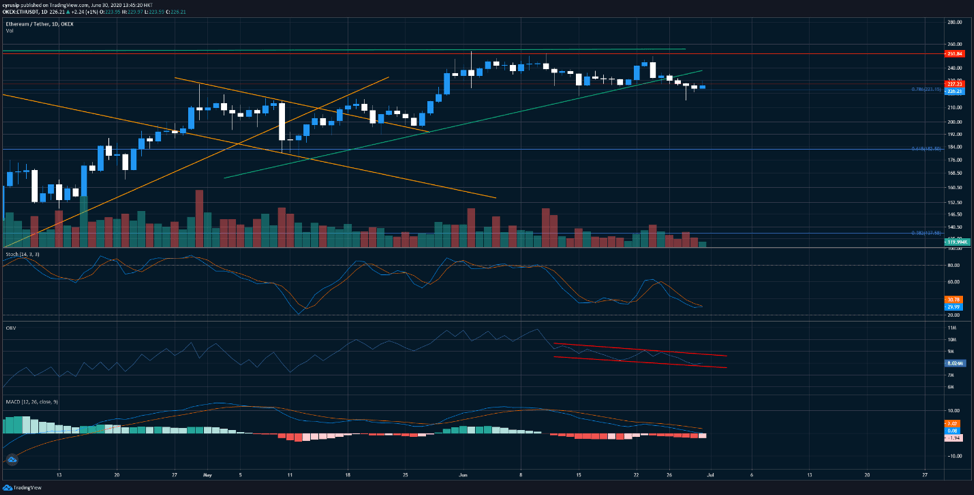
Source: OKEx; Tradingview
LTCUSDT –Time to turn?
LTCUSDT has been largely in range trading on the daily chart in the past three months, and the pair have been approaching the bottom support of the channel.
Indicators have shown that the positive momentum seems to have been gradually building up. The MOM indicator has formed a daily upward channel in the past two weeks, and the stochastic seems also formed a bottom recently.However, the RSI seems yet to confirm the divergence.
The recent downward trendline could be something that LTC bulls to keep a close eye on, which is located around 41 to 42. Breaking these trend lines could set the stage for retesting the 50 levels while the 39 areas could be the lower levels to watch.
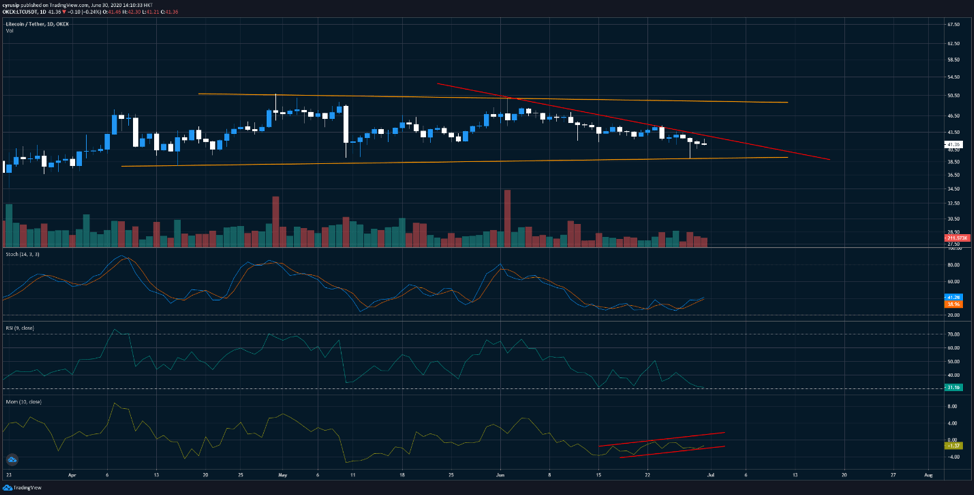
Source: OKEx; Tradingview
KNCUSDT –One more flag is coming?
KNCUSDT has been one of the top alt-performers in the Tuesday session. The pair has produced two bullish flags in the past two months. Indicators have shown that the pair may need further consolidation before having a third bullish flag. However, the timing of having a breakout could be hard to determine.
The Bollinger bands have once again squeezed, signaling the price volatility could pick up soon, and there was an increased likelihood of a sharp price move in either direction.
We’ve seen similar momentum patterns have been in development in the RSI and the MACD. If history repeats itself, markets could see a third bullish flag after the consolidation.
Sunday’s low at 0.9922 could be the lower level to watch, while 1.3 could be the upper area to focus on.

Source: OKEx; Tradingview
ADAUSDT – Range trading opportunities?
ADAUSDT has been moving within an upward channel since mid-March, and the pair have been approaching the lower support of the channel.
Momentum indicators have shown encouraging development, with the RSI has been producing some higher lows, and the MACD produced a bullish crossover. These signals could support the case of retesting of the upside resistance of the channel near 0.105.
The Bollinger bands squeeze also suggesting a breakout could potentially occur from here.
The pair seems to have found valid support at 78.6% Fibonacci Retracement near 0.0726, which could be the lower area to watch.
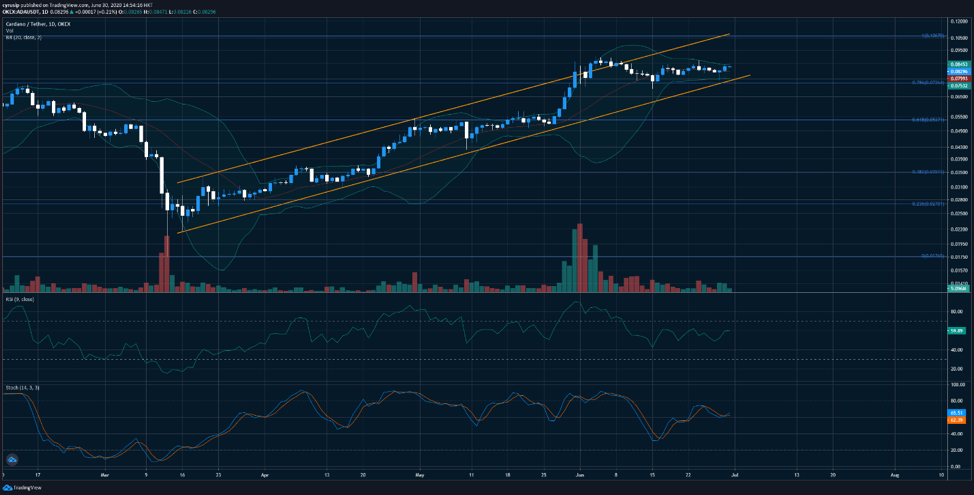
Source: OKEx; Tradingview
Author

Cyrus Ip
OKEx
Cyrus Ip has the privilege to work with OKEx as a Research Analyst, where he found some of the brightest talents in the crypto space.


