Bitcoin resistance levels to watch for 2025
- Bitcoin resistance levels
- Bitcoin support and resistance levels
- Bitcoin resistance levels today

Bitcoin’s price is once again testing one of the most important btc resistance levels on the chart, a level that has turned back every major bull run since 2017. If you follow the bitcoin cycle chart, this moment should have your full attention.
Let’s break down what this pattern reveals, how it connects to bitcoin resistance levels 2025, and what it might signal for both the short term and long term direction of the crypto markets.
The Channel That Has Guided Bitcoin for Nearly a Decade
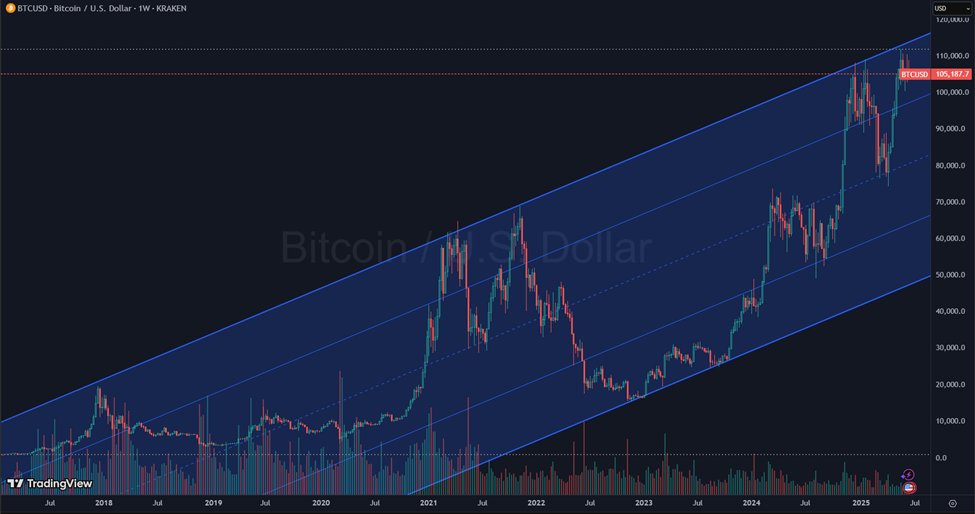
If you pull up a weekly chart of bitcoin (BTC/USD), you’ll see it, a rising parallel channel that connects Bitcoin’s major bull cycle tops. This isn’t a complex indicator. It’s a simple, clean structure that links:
- The 2017 high near $20,000
- The 2021 top at roughly $69,000
- And now, the current price levels in 2025
This channel has formed the backbone of bitcoin support and resistance levels for nearly eight years. It has caught both the euphoric highs and the painful lows. Now, Bitcoin sits right at the top of it, again.
In past cycles, this level marked the end of a major uptrend. So far, each time Bitcoin touched the upper channel line, it triggered sharp reversals and deep corrections. For traders and investors alike, this is one of the most important btc key price levels on the chart.
Bitcoin resistance levels today: Why this spot is critical
We’re not just approaching a technical boundary. We’re facing a level that has consistently signaled the transition from greed to fear. This is why the bitcoin resistance levels today matter so much.
When Bitcoin hit this upper zone in 2017, market sentiment was extremely bullish. Retail investors flooded in. Within weeks, the price of bitcoin collapsed by more than 80%.
In 2021, history repeated. Corporate buyers, tech companies, and institutional funds pushed Bitcoin into the same channel top, only to watch it fall into a bear market that erased two-thirds of its value.
Now, in 2025, Bitcoin is back at this same resistance line. This time, there’s even more at stake: wider adoption, more complex holders, and closer ties to global markets. Which way will it break?
The psychology of price peaks
Each time Bitcoin has neared this resistance level, the same emotions come into play. Late-stage optimism. Fear of missing out. Narratives of unlimited upside.
But technical levels often mark where hope collides with reality. And the price increases that happen right before a reversal tend to be the most aggressive, and misleading.
That is why understanding bitcoin support and resistance levels matters. These aren’t just chart lines. They reflect human behavior. They highlight the zones where the market historically changes its mind.
What if Bitcoin breaks above this time?
A clean break above this channel would be big. Not just a short-term spike, but sustained movement above the top boundary, backed by strong trading volume and demand from large buyers.
That would shift the entire long-term structure of the chart. It could suggest the start of a new market phase, one where previous highs no longer limit price. New btc resistance levels would need to be defined. Analysts would start discussing targets that seemed unreachable months ago.
But that kind of breakout has to be earned. It requires real buying interest, especially from institutions, not just retail traders chasing headlines.
What if Bitcoin gets rejected?
If Bitcoin fails here, as it has in past cycles, we could see a move back toward the current bitcoin support levels. Based on the structure of the channel, a drop of 30–40% would not be out of the ordinary.
It would hurt. But it would still fit within the pattern of a healthy digital asset operating in a long-term uptrend. This is what the bitcoin cycle chart 2025 suggests: that price moves within known parameters until proven otherwise.
For those managing risk, that channel provides clear boundaries. Above it: uncharted territory. Below it: familiar ground governed by historical support and resistance.
Correlation risk: The quiet threat
There’s another layer to this story: Bitcoin’s growing correlation with tech stocks and the broader market. Since institutional adoption ramped up, Bitcoin often trades more like a high-volatility growth stock than a safe haven.
When equity markets struggle, bitcoin’s price doesn’t always hold up. In fact, it often drops faster. This correlation risk has climbed steadily, especially during high-volatility periods.
That means even if Bitcoin looks strong on its own chart, external pressure could force it lower. If institutions need to reduce risk, they often start with volatile holdings, and Bitcoin still fits that category.
Structural changes in Bitcoin ownership
In earlier cycles, most holders were long-term believers. They had no shareholders or clients to answer to. They could afford to hold through years of drawdowns.
That’s no longer the case. Today’s holders include hedge funds, corporate treasuries, pension vehicles, and ETF products. These players have risk models. They sell when they’re required to, not when they want to.
This could increase the impact of any correction. Forced selling creates feedback loops. Prices drop, stop-losses get triggered, more selling follows. Understanding this dynamic helps explain why short term moves can accelerate quickly.
What traders and investors should watch
Whether you trade full time or just want to buy Bitcoin on dips, here’s what to focus on now:
- Volume: Watch for large-volume moves above the resistance line. Weak breakouts usually fail.
- Support: Identify and monitor btc support levels where buyers previously stepped in.
- Macro: Track how Bitcoin reacts when equities pull back. Strength during market weakness could be a bullish signal.
- Big Players: Pay attention to what large holders, like ETFs and funds, are doing.
The key here is not to predict. It’s to prepare. Use technical analysis to guide expectations, but let the market confirm the move before you commit capital.
Final thoughts: Read the chart, not the hype
The bitcoin resistance levels 2025 are not just another checkpoint. They’re the continuation of a pattern that has guided Bitcoin for nearly a decade. This pattern has helped define the price movements of the world’s biggest digital asset.
If Bitcoin breaks out, the narrative will shift, and so will the charts. But until then, traders and investors need to respect what the current data shows.
Above all, stay grounded. The best trades come from clarity and patience, not noise and emotion.
And remember: this article is for informational purposes only. Always do your own research and never invest more than you can afford to lose.
Author

Alexios Valonasis
SocialFire
Alexios Valonasis is an SEO Specialist and Web3 content strategist with over 6 years of experience in crypto marketing and more than 15 years in IT operations. He has led technical SEO, audits and content growth projects in the blockchain space.


