Bitcoin Price Top Forecast: 3 possible reasons for the crash, $4,420 or back to $6,350?
- BTC/USD crashed spectacularly and hit the lowest levels since October.
- It is hard to find clear reasons for the plunge that may have been a long time in the making.
- The technical levels to watch are broader than usual and the experts are optimistic only in the short-term.

Volatility is finally back. And with a vengeance. Bitcoin crashed not only below $6,000 but also below the previous 2018 low and hit $5,200, the lowest level since October 2017. Other cryptocurrencies also dropped, but the falls in Ethereum and Ripple were not of the same magnitude.
What happened? Experts scramble to provide full explanations, but there are several explanations:
1) Bitcoin Cash hard fork
The hard fork of Bitcoin to the original BTC and Bitcoin Cash was one of the triggers behind the explosion of crypto prices in late 2017. And now, the fork in Bitcoin Cash may have been one of the reasons for the crash. The attention to the new shiny toys may have drawn attention and also funds from BTC.
2) Central-bank issued cryptos?
Cristine Lagarde, the Managing Director of the International Monetary Fund, suggested that central banks should issue their own cryptocurrencies. This is not the vision that cyber-punks had in mind when Bitcoin was conceived. Having government controlled and distributed digital coins may make the independent and decentralized ones obsolete.
3) Markets cannot wait for an ETF any longer
In some case, no news is good news, but in this case, it may have been bad news. Anticipation for an Exchange Traded Fund has been high in recent months. However, the SEC rejected several Bitcoin ETF requests and delayed others. In the meantime, Bitcoin volatility dropped. But at some point, patience runs out, weak hands sell, and the levee break. This is what may have happened here.
An ETF is critical to attracting mainstream money to the digital coin. Prices have moved quite a bit on any delay, rejection or hope for an approval. See: Bitcoin ETF explained: 9 questions and answers about the critical crypto catalyst
What's next? FXStreet experts Tomas Salles explained that the worst that could happen is that prices settle at current levels and trade in a narrow range. But the BTC/USD could either extend its drops or bounce back up.
Get 24/7 Crypto updates in our social media channels: Give us a follow at @FXSCrypto and our FXStreet Crypto Trading Telegram channel
BTC/USD Technical Analysis - $4,400 or $6,400?
-636779694832438229.png)
BTC/USD broke below uptrend support, the round number of $6,000 and the 2018 low of $5,770. These now turn into resistance lines. The post-crash high point of $5,655 is next. $5,200 was the low point of the crash, seen only on Thursday, a day after the downfall.
Below, we are back to levels last seen in 2017: $5,000 is a very round number and will be watched by many. Further down, Tomas Salles notes $4,420 as the next target.:
And if we see a significant recovery, where can BTC/USD go to? $6,200 was a critical support line in late October and early November. $6,350 provided support when the cryptocurrency was suffering very low volatility in October.
The Relative Strength Index is deep into oversold territory. Does this indicate an imminent bounce? Momentum remains to the downside.
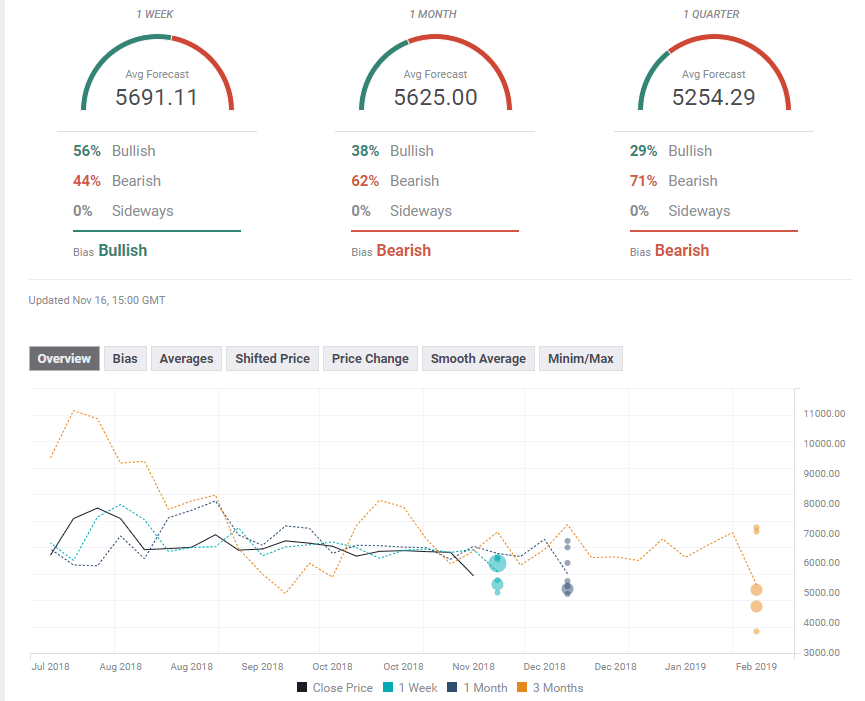
The Forecast Poll of experts shows a bullish bias for the short term but a bearish one in both the medium and long term. Forecasters have sharply downgraded their projections following the downfall.
Author

Yohay Elam
FXStreet
Yohay is in Forex since 2008 when he founded Forex Crunch, a blog crafted in his free time that turned into a fully-fledged currency website later sold to Finixio.


