Bitcoin price prediction: Downside is the path of least resistance - Confluence Detector
- BTC/USD flirts with $3,600 amid bearish sentiments.
- More downside may be in store towards the end of the year.

Bitcoin is hovering around $3,600 level. The first digital coin has lost about 4% since this time on Thursday and entered a short-term consolidation stage amid thin holiday market conditions. While the price recovered from the intraday low at $3.567, the upside momentum is nowhere to be seen, which clouds the short-term technical picture.
BTC/USD the daily confluence detector
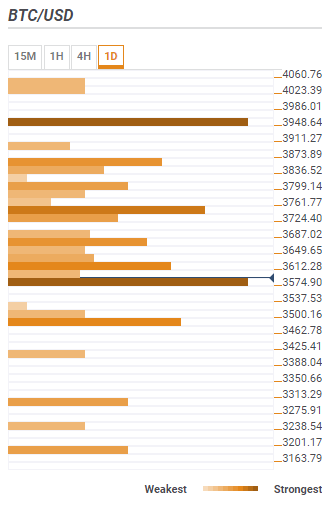
Currently, BTC/USD is well supported by a confluence of important technical indicators, clustered right under the current price. They include 61.8% Fibo retracement weekly, the previous day low and Bollinger Band 4-hour Lower. If the coin breaks this barrier and goes below $3,550, the sell-off may be extended towards $3,500, which is psychologically important level, strengthened by previous month low. The next support lies with $3,300. It is guarded by the Pivot Point 1-month Support 1. This area separates us from the lowest level of 208, reached during the previous week ($3,126).
The road to the North won't be easy as it is packed with resistance levels. Right above the current price, we face a host of SMA levels, Bollinger Band, 15-min Middle, Bollinger Band, 15-min Higher, Bollinger Band, 1-day Middle, as well as the precious 1-hour high and 15-min high.
Once firmly above $3,620-30, BTC/USD will bump into SMA5 4-hour and Bollinger Band, 1-hour Middle. They are located above $3,650 and precede a stronger resistance on approach to $3,760 created by 61.8% Fibo retracement daily. This resistance area extends towards $3,800/30 (SMA10 daily and Previous high 1-day). A sustainable move higher will open the way towards $3,900 and $3,950 with Fibo retracement daily, Bollinger Band, 1-hour Upper, and SMA10 daily, located on approach.
BTC/USD, 1D
Author

Tanya Abrosimova
Independent Analyst


