- Data from Skew show that Bitcoin futures volume has been growing on CME in the last one month.
- Bitcoin must clear the prominent resistance at $8,248 to higher levels around $9,000.
CME Bitcoin futures contracts have been key players in the cryptocurrency market since their launch in December 2017. The contracts which are settled at the end of every month provide an insight into the involvement of institutional investors with the crypto market.
The rising volume of Bitcoin futures volume on CME in the last month is a key indicator of the positive sentiments from institutional investors. The number of investors going long on Bitcoin futures is rising according to data provided by Skew, a crypto analytical company. Bitcoin longs position on CME has stepped above 1,100 after grinding to almost zero.
Long positions held by institutional accounts at the CME have been rising again in October.
— skew (@skew_markets) October 20, 2019
For reference, institutions include pension funds, endowments, insurance companies, mutual funds & portfolio/investment managers whose clients are predominantly institutional. pic.twitter.com/96N2XZwo9e
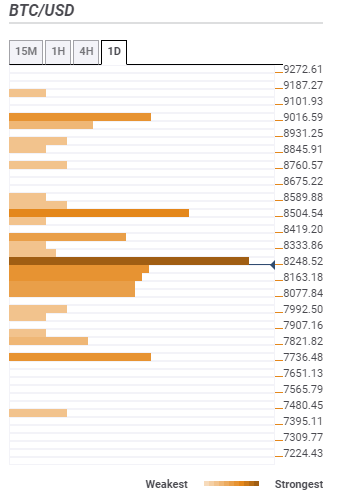
Bitcoin confluence levels
Bitcoin price is slightly in the green on the second day of this week’s trading. The crypto stepped briefly above $8,300 on Monday but failed to sustain gains towards the key $8,400. At the time of writing, Bitcoin is trading at $8,224 after recovery from a weekly low formed at $8,154.
According to the confluence detector tool, Bitcoin is staring into the most prominent resistance at $8,248. The numerous indicators making this zone almost impenetrable include the Bollinger Band one-day middle, BB one-hour middle, previous high 15-minutes, the Simple Moving Average 100 15-mins, Fibonacci 61.8% one-week, previous high one-hour and previous high four-hour among others.
The other hurdle that is in line to hinder growth towards $9,000 is $8,500. Some of the indicators at this range are the 161.8% one-day, previous week high and the Fibo 23.6% one-month.
On the downside, the region between $8,077 and $8,163 is a wide support range that continues to prevent price dips below $8,000. Movement below $8,000 will find support at $7,736 according to the confluence detector.
Information on these pages contains forward-looking statements that involve risks and uncertainties. Markets and instruments profiled on this page are for informational purposes only and should not in any way come across as a recommendation to buy or sell in these assets. You should do your own thorough research before making any investment decisions. FXStreet does not in any way guarantee that this information is free from mistakes, errors, or material misstatements. It also does not guarantee that this information is of a timely nature. Investing in Open Markets involves a great deal of risk, including the loss of all or a portion of your investment, as well as emotional distress. All risks, losses and costs associated with investing, including total loss of principal, are your responsibility. The views and opinions expressed in this article are those of the authors and do not necessarily reflect the official policy or position of FXStreet nor its advertisers. The author will not be held responsible for information that is found at the end of links posted on this page.
If not otherwise explicitly mentioned in the body of the article, at the time of writing, the author has no position in any stock mentioned in this article and no business relationship with any company mentioned. The author has not received compensation for writing this article, other than from FXStreet.
FXStreet and the author do not provide personalized recommendations. The author makes no representations as to the accuracy, completeness, or suitability of this information. FXStreet and the author will not be liable for any errors, omissions or any losses, injuries or damages arising from this information and its display or use. Errors and omissions excepted.
The author and FXStreet are not registered investment advisors and nothing in this article is intended to be investment advice.
Recommended Content
Editors’ Picks
Ripple's move above this key level could trigger nearly 50% rally for XRP
Ripple has overcome a critical resistance level and flipped into a support floor on the weekly time frame. This development happened while XRP tightly consolidated for roughly 250 days. Investors can expect XRP to kickstart a massive rally.
Optimism price outlook with nearly $90 million worth of OP tokens flooding markets on Friday
Optimism volatility has shrunk in the ours leading to the network’s cliff unlock. It joins the likes of dYdX and Sui, which have similar events on their calendars. As token unlocks are often considered bearish catalysts, investors should brace for a reaction after the event.
Top 3 Price Prediction Bitcoin, Ethereum, Ripple: Retail watches from the sidelines with a bias for shorts
Bitcoin could clear $73,777 peak as BTC bulls resurface. Ethereum might fall 10% before next leg up as ETH RSI teases with sell signal. XRP could lose $0.6000 threshold as Ripple bulls fail to show up.
Jito price could hit $6 as JTO coils up inside this bullish pattern
Jito price action shows a potential cup and handle formation. Based on theoretical measurement rules, a successful breakout could yield a 56% rally to $6.0. A breakdown of the $3.86 support level would create a lower low for JTO and invalidate the bullish thesis.
Bitcoin: BTC may have recovered, but is it out of the woods?
Bitcoin’s (BTC) upward momentum has shown a significant decline for the past two weeks or so. This development led to a bearish signal on the weekly and an uncertain outlook on the monthly.