Bitcoin Price Prediction: BTC/USD journey to $12,000 suffers setback – Confluence Detector
- Bitcoin managed to hold support at $11,000 after losing traction and slumping sharply.
- BTC/USD recovery has stalled short of $11,400 as more buyers stay in the sideline unsure of the uptrend.

Bitcoin was forced back to the drawing board with the bearish leg drawing closer to $11,000. Note that, the price prediction on Tuesday talked about Bitcoin likelihood of falling to $11,000 before making another attempt at crossing above the psychological $12,000.
BTC/USD explored levels around $11,000 towards the end of the American session. Recovery from the support has been slow. BTC/USD stepped above $11,300 but the resistance at $11,400 is still intact.
The largest cryptocurrency is exchanging hands at $11,388 at the time of writing. The RSI appears to be have established support at the midline. However, reversal has been delayed to emphasize that selling pressure is present in the market.
This means that the remaining part of the journey to $12,000 would be an uphill task. However, if Bitcoin brings down the seller congestion at $11,400 and $11,600, more buyers are bound to join the market in order to capitalize on the anticipated spike above $12,000.
The MACD illustrates the same picture especially with a bearish divergence under it. In addition, it is yet to recovery from the downward momentum from highs around 607.
BTC/USD daily chart
 (26)-637340189399290928.png)
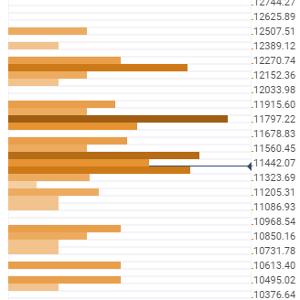
Bitcoin confluence levels
Resistance one: $11,441 – A significant resistance zone with a cluster indicators including the previous high 15-minuntes, the Bollinger Band one-hour middle, the previous high 1-hour, the previous high 4-hour and the Bollinger Band 15-minutes.
Resistance two: $11,797 – Home to the SMA 200 1-hour, the Bollinger Band one-day middle, the SMA 100 4-hour, the previous high one-day and the SMA ten one-day.
Resistance three: $11,915 – As highlighted by the Fibonacci 38.2% one-week and the Bollinger Band 4-hour upper curve.
Support one: $11,323 – A subtle support areas hosting the Fibo 23.6% one-day, the Bollinger band 15-minutes lower curve and the BB 4-hour lower curve.
Support two: $11,205 – Hosts the Bollinger Band 1-hour lower curve and the pivot point one-week support one.
Support three: $10,968 – As highlighted by the Fibonacci 23.6% one-minute.
Author

John Isige
FXStreet
John Isige is a seasoned cryptocurrency journalist and markets analyst committed to delivering high-quality, actionable insights tailored to traders, investors, and crypto enthusiasts. He enjoys deep dives into emerging Web3 tren


