Bitcoin Price Prediction: BTC/USD inverse H&S pattern, is a rally to $10,000 imminent? – Confluence Detector
- Bitcoin price spiraling towards $9,200 support after $9,400 and $9,300 caved in.
- The formed H&S pattern is Bitcoin’s remaining ticket to $10,000 but where is the volume?

Bitcoin price continues to suffer under the strong arm of the bears. The rejection from $9,600 seems unstoppable until Bitcoin returns to $9,000. Thursday’s support above $9,400 failed to hold, leaving a gap that has been explored by the bears. Bitcoin has slipped under $9,300 (the Asian session support). At the moment, the largest cryptocurrency by market capitalization is trading at $9,270.
The 1-hour chart shows Bitcoin trading under the moving averages. The 100 SMA is holding the position at $9,394 while the 50 SMA is currently at $9,415. The dive under $9,300 is likely to have rejuvenated the seller’s energy because Bitcoin continues to fall towards $9,200.
The inverse head and shoulders bullish scenario
Although the bulls in the market are enduring yet another battering this week, hope is not lost. The formation of the head and shoulders (H&S) pattern as observed from the chart shows that Bitcoin could soon reverse the trend massively towards $10,000. H&S pattern is usually useful in technical analysis to predict reversals from downtrends. In this case, a bounce is expected at $9,200, leading towards the psychological $10,000.
BTC/USD 1-hour chart
-637281351119525277.png)
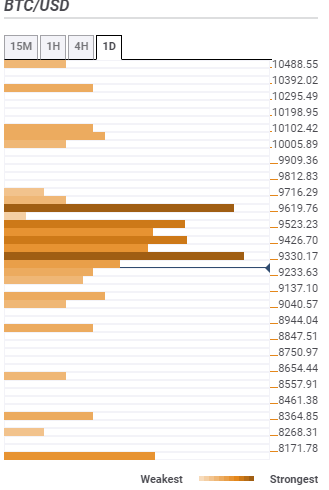
Bitcoin daily confluence resistance and support levels
Resistance one: $9,330 – Highlighted by the Fibonacci 23.6% one-week, the previous high 15-minutes, the Bollinger Band 1-hour lower, Bollinger Band 4-hour lower curve and the Fibo 23.6% one-day.
Resistance two: $9,426 – The selling pressure in this zone is highlighted by the Bollinger Band 1-hour middle curve, the SMA 100 1-hour, SMA 100 15-minutes, the previous high 4-hour, and the 61.8% one-day.
Resistance three: $9,619.76 – This zone is home to the SMA 100 4-hour, the Bollinger Band 1-day middle curve, and the Fibo 161.8% one-day.
Support one: $9,233 – Highlighted by the previous low 1-hour, previous low 15-minutes, previous low one-day, and the pivot point one-day support one.
Support two: $9,137 – The zone where the pivot point daily support and the previous week low converge.
Support three: $8,944 – Highlighted by the Fibonacci 61.8% one month.
Author

John Isige
FXStreet
John Isige is a seasoned cryptocurrency journalist and markets analyst committed to delivering high-quality, actionable insights tailored to traders, investors, and crypto enthusiasts. He enjoys deep dives into emerging Web3 tren


