- Bitcoin is dancing at the edge of a cliff ($11,000) as recovery towards $11,400 becomes tougher.
- BTC/USD seems to have just enough energy to hold above $11,000 but upward action continues to be limited.
Bitcoin bulls seem to be spending all their energy defending support at $11,000 and are left with very little to actualize the bullish case to $11,400. On Thursday, BTC/USD recovered magnificently past $11,000 but hit a barrier at $11,200. Besides, Bitcoin and most of the assets in the market are in the red as we prepare to usher in the Asian session.
At the moment, the price is doddering at $11,014. Holding above $11,000 is key for the bull-run to $11,400. However, the RSI is threatening a retreat from the overbought region. In other words, the ongoing decline is likely to continue and even push Bitcoin lower.
On the other hand, the MACD is holding well within the positive region. This shows that in spite of the retreat, BTC/USD still has some buying support. In addition, the price is sitting significantly above the moving averages. In the daily range, the 50 SMA holds the position at $9,514 while the 200 SMA is at $8,695.
BTC/USD daily chart
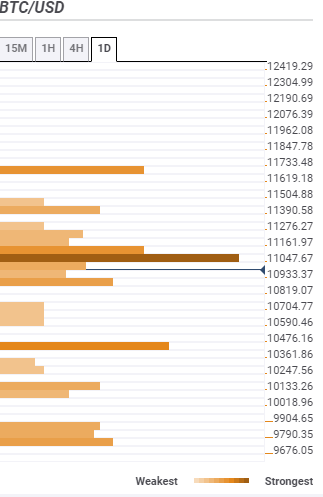
Bitcoin confluence levels
According to the confluence levels, Bitcoin is facing the sturdiest resistance at $11,047. Holding the ground within this zone is the previous high 15-minutes, the SMA ten 15-minutes, SMA 100 15-minutes, the Bollinger Band 1-hour middle curve and the previous high 1-hour among other indicators.
Glancing higher, a second resistance lies at $11,161 as highlighted by the Bollinger Band 1-day upper curve and the previous high 4-hour. The next key hurdle is the one at $11,733; its home to the pivot point one-day resistance three and the pivot point one-month resistance three.
It is essential that Bitcoin finds support preferably above $11,200, however, the selling pressure will continue to force a return under $11,000. Support is envisioned at $10,933 as shown by various indicators including the Bollinger Band 1-hour lower curve, the SMA 100 1-hour and the pivot point one-day support one. A break below this the initial support might not encounter any interruptions until it hits the buyer congestion at $10,476. Losses under $10,000 will seek refuge at $9,904, $9,790 and $9,676.
Information on these pages contains forward-looking statements that involve risks and uncertainties. Markets and instruments profiled on this page are for informational purposes only and should not in any way come across as a recommendation to buy or sell in these assets. You should do your own thorough research before making any investment decisions. FXStreet does not in any way guarantee that this information is free from mistakes, errors, or material misstatements. It also does not guarantee that this information is of a timely nature. Investing in Open Markets involves a great deal of risk, including the loss of all or a portion of your investment, as well as emotional distress. All risks, losses and costs associated with investing, including total loss of principal, are your responsibility. The views and opinions expressed in this article are those of the authors and do not necessarily reflect the official policy or position of FXStreet nor its advertisers. The author will not be held responsible for information that is found at the end of links posted on this page.
If not otherwise explicitly mentioned in the body of the article, at the time of writing, the author has no position in any stock mentioned in this article and no business relationship with any company mentioned. The author has not received compensation for writing this article, other than from FXStreet.
FXStreet and the author do not provide personalized recommendations. The author makes no representations as to the accuracy, completeness, or suitability of this information. FXStreet and the author will not be liable for any errors, omissions or any losses, injuries or damages arising from this information and its display or use. Errors and omissions excepted.
The author and FXStreet are not registered investment advisors and nothing in this article is intended to be investment advice.
Recommended Content
Editors’ Picks
Crypto Today: Bitcoin retakes $95K, Binance lists ChainGPT, Kenya moves to legalize digital assets
The cryptocurrency market snapped its three-day losing streak on Friday, gaining 3% as it reached $3.2 trillion valuation. Bitcoin price struggled to retake the $95,000 support level.
Binance, Uniswap, Bitget traders see $14.8B market cap rise as exchange tokens rebound
Exchange native tokens including Binance Coin, Uniswap, Bitget rallied on Friday as crypto markets flashed early rebound signals. Could this trigger a major breakout phase in the coming days?
Solana Price Forecast: SOL network update signals more downside risks
Solana price established a firm support above $180 on Friday as the crypto market sell-off subsided. Recent market reports suggest Solana's recently proposed network update could trigger further downside risks ahead.
Three reasons why Bitcoin might correct while XRP, Ethereum rally next week
Bitcoin, Ethereum and XRP gained slightly on Friday, even as the three assets erased their value in the past seven days. Experts predict a higher-than-usual volatility in both BTC and ETH next week, with a likelihood of a correction in Bitcoin in Q1 2025.
Bitcoin: Room for a recovery or continuation of the pullback?
Bitcoin’s (BTC) price slightly recovers and trades around $94,700 on Friday after declining nearly 6% earlier this week. US Bitcoin spot Exchange Traded Funds (ETF) data shows signs of mild recovery, with a total net inflow of $462.2 million until Thursday. A 10xResearch report released this week projects Bitcoin’s price action for the upcoming major events in January.
Best Forex Brokers with Low Spreads
VERIFIED Low spreads are crucial for reducing trading costs. Explore top Forex brokers offering competitive spreads and high leverage. Compare options for EUR/USD, GBP/USD, USD/JPY, and Gold.