Bitcoin price Prediction: BTC/USD dip is coming in the wake of the rally – Confluence Detector
- Bitcoin slides under $11,000 again as more declines flicker for the upcoming sessions.
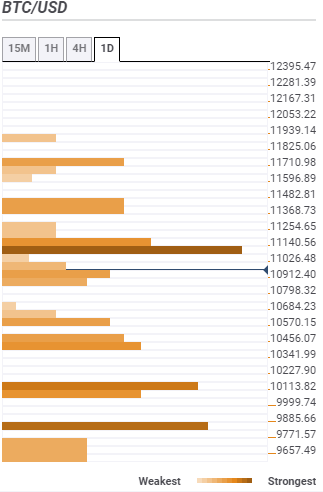
- The confluence detector tool places the first support at $10,912, the second at $10,570 and the third at $10,341.

Bitcoin’s intent to stay above $11,000 becomes difficult with each passing second. A bullish reversal on Wednesday saw BTC/USD reclaim the ground above $11,000. However, on trading levels of $11,361 losses took effect immediately. At the time of writing, Bitcoin has retreated to $10,954. The downtrend could soon retest support at $10,800. Besides, a reversal seems imminent following the massive rally from the narrow range between $9,000 and $9,300.
Related reading: Cryptocurrency Market News: Bitcoin $50,000 bullseye in 2021 – CNBC’s Brian Kelly
The question, however, is whether Bitcoin has the potential to hold at higher support, preferably above $10,000? The daily chart shows the RSI retreating fast within the overbought region. This downward trend highlights the already overbought condition of Bitcoin. It is also vital to note that buyers are adamant to let Bitcoin slide as seen with MACD at 431. The tug war is bound to continue in the near term. In the meantime, let us look into the possible confluence resistance and support levels.
BTC/USD daily chart
 (9)-637316933017676604.png)
Bitcoin price confluence resistance and support areas
Resistance one: $11,026 – This a subtle seller congestion zone that is currently highlighted by the SMA five 15-minutes, SMA ten 15-minutes, SMA five 1-hour and the Bollinger Band 15-minutes middle.
Resistance two: $11,140 – This is the strongest hurdle where a cluster of indicators convergence including the previous high 1-hour, the SMA 50 1-hour, the SMA 200 15-minutes, the pivot point one-month resistance two and the Fibo 61.8% one-day.
Resistance three: $11368 to $11,482 – This wide zone holds the Bollinger Band 1-hour upper curve, the previous high one-day and the pivot point one-day resistance one.
Support one: $10,912 – This a minor support zone but holds the pivot point one-day support one and the Bollinger Band one-day upper curve.
Support two: $10,570 – This zone is home to the pivot point one-day support two, the Fibo 161.8% one-day and the SMA five one-day.
Support three: $10,341 – highlighted by the pivot point daily support three and the pivot point one-week resistance three.
Author

John Isige
FXStreet
John Isige is a seasoned cryptocurrency journalist and markets analyst committed to delivering high-quality, actionable insights tailored to traders, investors, and crypto enthusiasts. He enjoys deep dives into emerging Web3 tren


