- Bitcoin price is seeing a massive consolidation above the 200-week SMA at $22,794.
- The fractal formation is on its last leg and is yet to retest $23,666 before collapsing to $21,140 or other targets.
- A daily candlestick close above $24,565 that flips it into a support floor will invalidate the bullish theiss.
Bitcoin price shows lackluster performance despite the announcement of BlackRock’s entry into crypto. Due to the spotlight on Ethereum and its upcoming Merge update, investors seem to be neglecting BTC, which could explain its slow and sideways movement.
However, this could take a turn, in terms of volatility, as bears take control due to this fractal formation that forecasts a steep correction.
Bitcoin price awaits an opportune moment
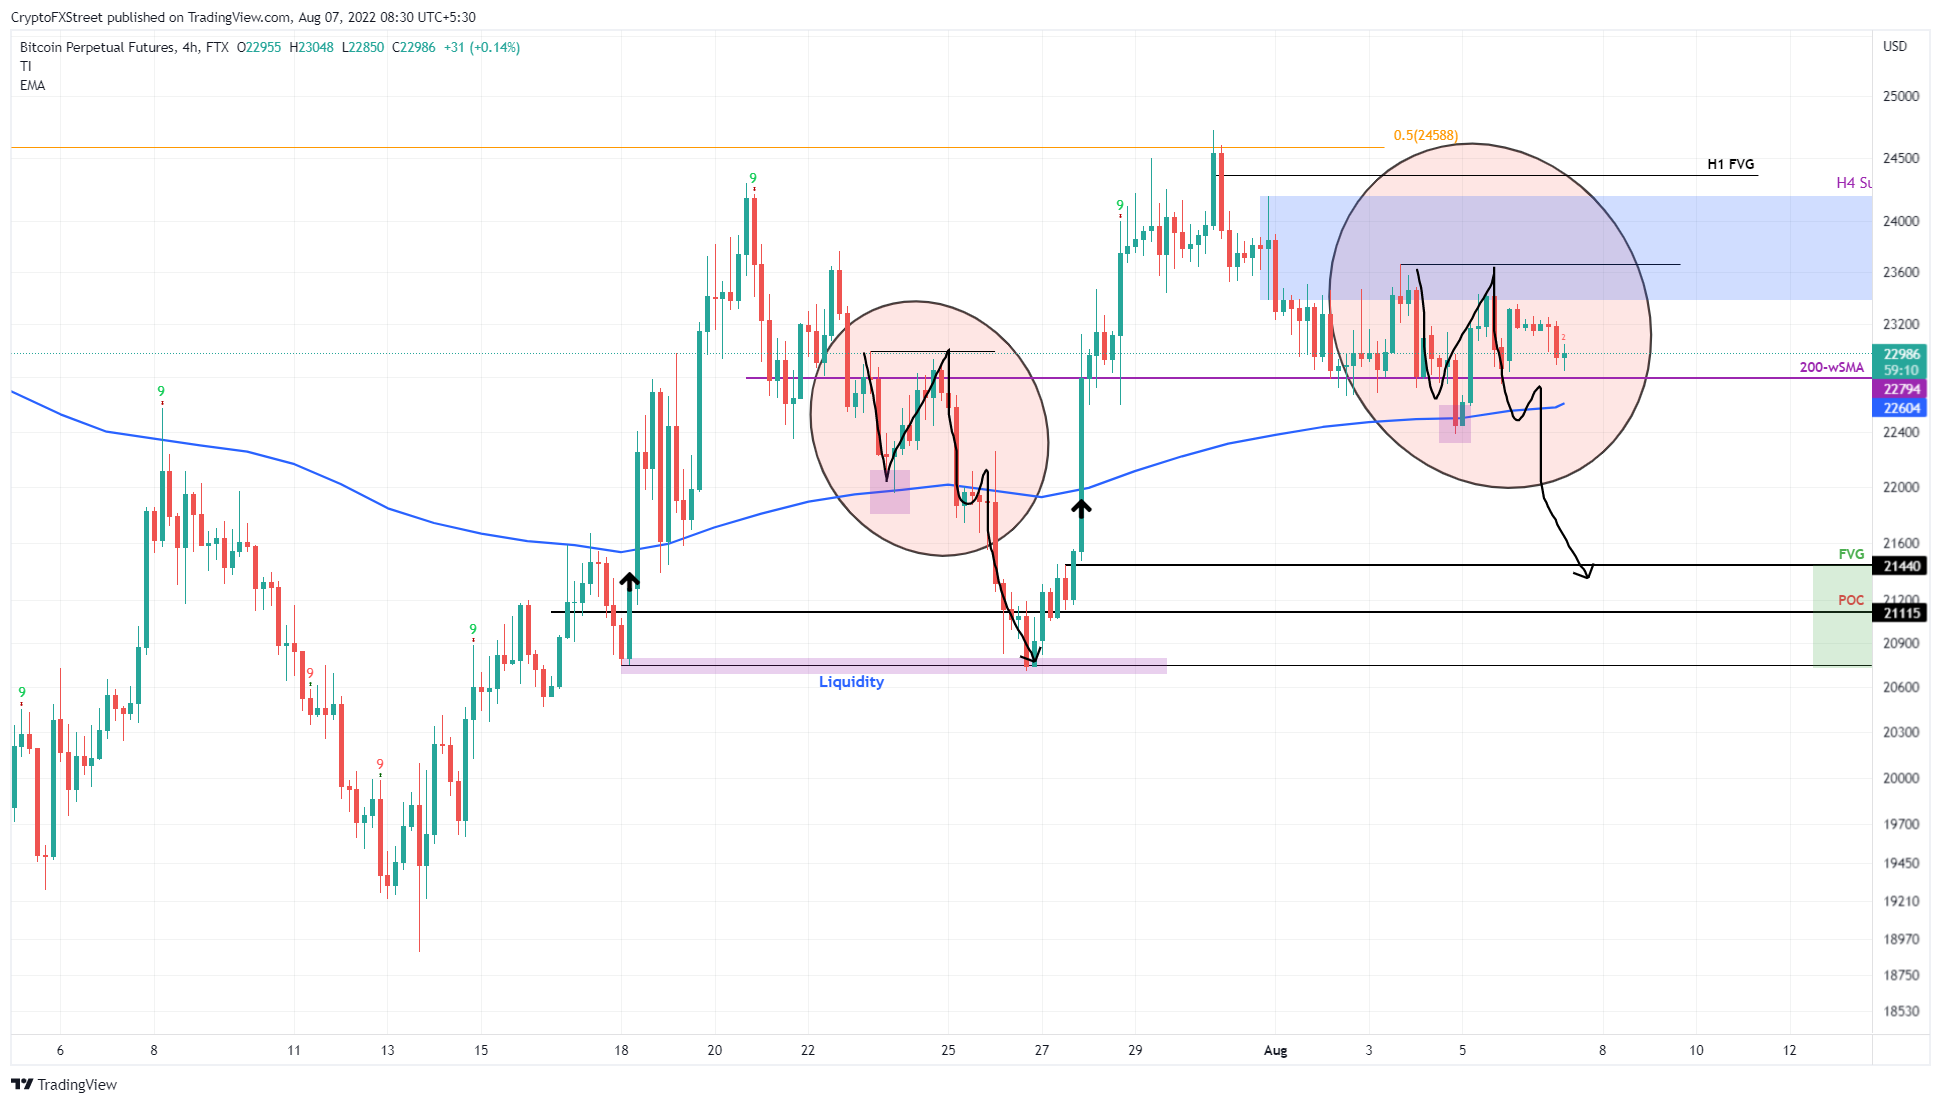
Bitcoin price fractal in formation mentioned above revolves around the 30-day Exponential Moving average (EMA). The last time BTC broke above this above EMA, it rallied roughly 13% and set a local top at $24,296.
The undoing of this move took place over the next five days and consisted of forming a double top at $22,999 and a swift breakdown of the 30-day EMA, leading to another leg down. This price action occurred over the course of eight days and involved a complete undoing of gains.
The fractal seems to be repeating yet again, but this time around, when BTC breached the 30-day EMA, it set a local top at $24,565, which is the midpoint of the 42% that occurred between April and June 2022.
A double top formation at $23,666 is the only move that is left to complete the fractal. Once this double top is formed, the chances of an eventual decline will increase. In such a case, at least based on historical data, Bitcoin price could revisit $21,440, which will fill the price inefficiency.
BTC/USDT 1-day chart
On the other hand, if Bitcoin price breaches through the $23,666 resistance level, it will invalidate the fractal. The bearish thesis, however, will face invalidation if BTC produces a daily candlestick close above $24,565 and flips it into a support floor.
Information on these pages contains forward-looking statements that involve risks and uncertainties. Markets and instruments profiled on this page are for informational purposes only and should not in any way come across as a recommendation to buy or sell in these assets. You should do your own thorough research before making any investment decisions. FXStreet does not in any way guarantee that this information is free from mistakes, errors, or material misstatements. It also does not guarantee that this information is of a timely nature. Investing in Open Markets involves a great deal of risk, including the loss of all or a portion of your investment, as well as emotional distress. All risks, losses and costs associated with investing, including total loss of principal, are your responsibility. The views and opinions expressed in this article are those of the authors and do not necessarily reflect the official policy or position of FXStreet nor its advertisers. The author will not be held responsible for information that is found at the end of links posted on this page.
If not otherwise explicitly mentioned in the body of the article, at the time of writing, the author has no position in any stock mentioned in this article and no business relationship with any company mentioned. The author has not received compensation for writing this article, other than from FXStreet.
FXStreet and the author do not provide personalized recommendations. The author makes no representations as to the accuracy, completeness, or suitability of this information. FXStreet and the author will not be liable for any errors, omissions or any losses, injuries or damages arising from this information and its display or use. Errors and omissions excepted.
The author and FXStreet are not registered investment advisors and nothing in this article is intended to be investment advice.
Recommended Content
Editors’ Picks
Ripple's move above this key level could trigger nearly 50% rally for XRP
Ripple has overcome a critical resistance level and flipped into a support floor on the weekly time frame. This development happened while XRP tightly consolidated for roughly 250 days. Investors can expect XRP to kickstart a massive rally.
Optimism price outlook with nearly $90 million worth of OP tokens flooding markets on Friday
Optimism volatility has shrunk in the ours leading to the network’s cliff unlock. It joins the likes of dYdX and Sui, which have similar events on their calendars. As token unlocks are often considered bearish catalysts, investors should brace for a reaction after the event.
Top 3 Price Prediction Bitcoin, Ethereum, Ripple: Retail watches from the sidelines with a bias for shorts
Bitcoin could clear $73,777 peak as BTC bulls resurface. Ethereum might fall 10% before next leg up as ETH RSI teases with sell signal. XRP could lose $0.6000 threshold as Ripple bulls fail to show up.
Jito price could hit $6 as JTO coils up inside this bullish pattern
Jito price action shows a potential cup and handle formation. Based on theoretical measurement rules, a successful breakout could yield a 56% rally to $6.0. A breakdown of the $3.86 support level would create a lower low for JTO and invalidate the bullish thesis.
Bitcoin: BTC may have recovered, but is it out of the woods?
Bitcoin’s (BTC) upward momentum has shown a significant decline for the past two weeks or so. This development led to a bearish signal on the weekly and an uncertain outlook on the monthly.