Bitcoin price prediction: After brief flirtation, can BTC/USD go back into the $12,000-zone?
- BTC/USD is currently trending around $11,470 as markets opened this Wednesday.
- Daily confluence detector shows three healthy resistance levels on the upside.

BTC/USD has had an interesting Tuesday. The price crossed $12,000 for the first time in nearly a month. However, the bears stepped right back in and dropped the price to $11,490. The digital asset has had a bearish start to Wednesday, as the price fell further to $11,470. The daily confluence detector shows us that there are three healthy resistance levels on the upside, which the bulls will need to overcome.
BTC/USD daily chart
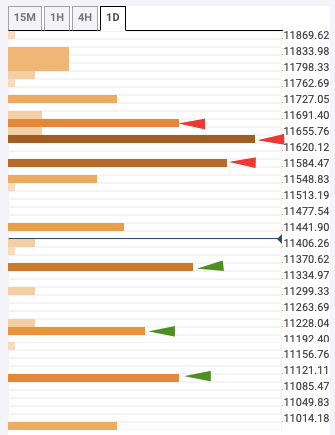
The three resistance levels are at $11,600, $11,645 and $11,700. $11,600 has the 1-day Fibonacci 38.2% retracement level, while $11,645 has the 1-month Fibonacci 61.8% retracement level. Finally, $11,700 has 1-week pivot point resistance 2.
On the downside, there are three support levels at $11,350, $11,200 and $11,100. $11,350 sees the confluence of the 5-day simple moving average (SMA 5) curve, 4-hour Bollinger band middle curve, SMA 10 and 1-day Fibonacci 61.8% retracement level. The $11,200-level has the 1-hour previous low and 1-day pivot point support 1. Finally, $11,100 has the 1-week pivot point resistance 1.
Author

Rajarshi Mitra
Independent Analyst
Rajarshi entered the blockchain space in 2016. He is a blockchain researcher who has worked for Blockgeeks and has done research work for several ICOs. He gets regularly invited to give talks on the blockchain technology and cryptocurrencies.


