Bitcoin price is bound for another downswing to $25,000, says trading veteran
- Bitcoin price has once again defended a crucial support level at $30,000.
- The flagship cryptocurrency has established a daily downtrend but holds its ground.
- Peter Brandt, a trading veteran, suggests that Bitcoin is still poised for another leg down in the near future.

Bitcoin price is currently around $31,200 after another critical recovery from $29,241. So far, BTC hasn't closed below $30,000 since breaking it out, making this level extremely strong. However, despite defending this point, Peter Brandt still thinks Bitcoin price could fall towards $25,000.
Bitcoin price action is hard to predict, says Peter Brandt
In his latest analysis, trading veteran and influencer Peter Brandt starts by saying that nobody really knows where Bitcoin is headed next. However, during the 2015-2017 bull run, there was a pattern that was repeated several times.
History question for the #Cryptotwitterites of the world
— Peter Brandt (@PeterLBrandt) January 20, 2021
Does anyone remember this Jan 8, 2018 Tweet, just before the parabolic advance was broken?
A derivative of the BHLD is the Hump..Slump..Pump..Dump.
It takes really old traders to come up with chart names such as this. pic.twitter.com/gcm2nsbq18
Bitcoin had several 30% or more corrections and Brandt discerned a pattern called Hump, Slump, Pump and Dump (HSPD). According to Brandt, this pattern was seen several times during the last bull rally and it seems to be happening again.
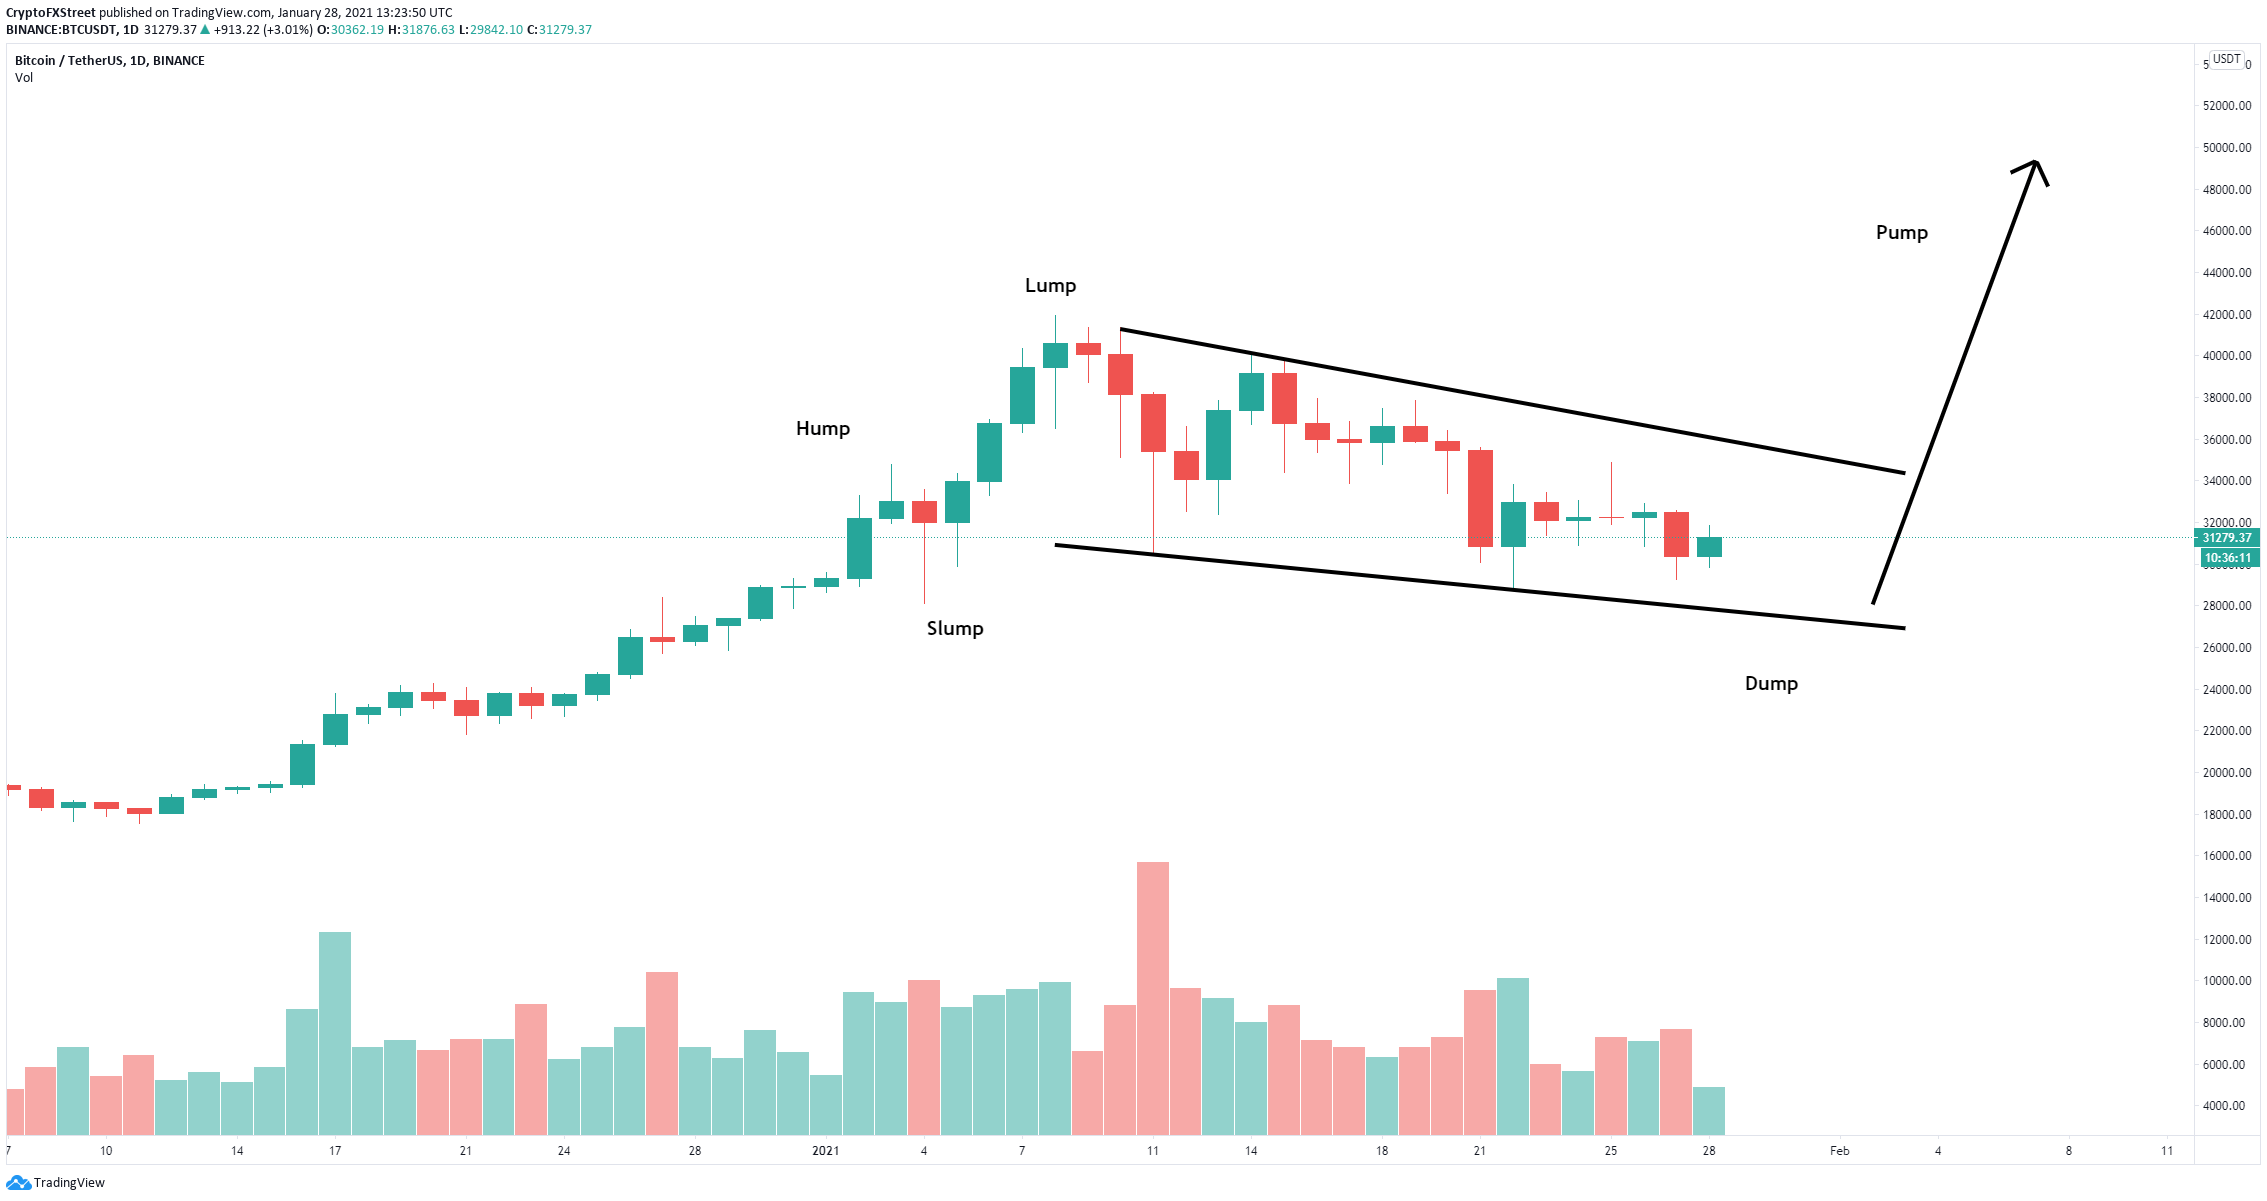
BTC/USD daily chart
According to the HSPD pattern, the Slump was formed at $25,343. Another low below this point would fulfill the Hump-to-Dump sequence. Peter Brandt also added that:
In fact, a low and close today below the Jan 21 close would flip the Daily Trend Model to down. As I have also pointed out over the past two years, the Factor Daily Trend Model is fickle during congestions, turning UP near the upper end of a trading range and DOWN near the bottom of a trading range. A decline to below the Jan low would represent a 34% correction, in line with the nine 30%-plus corrections during the 2015-2017 bull run.
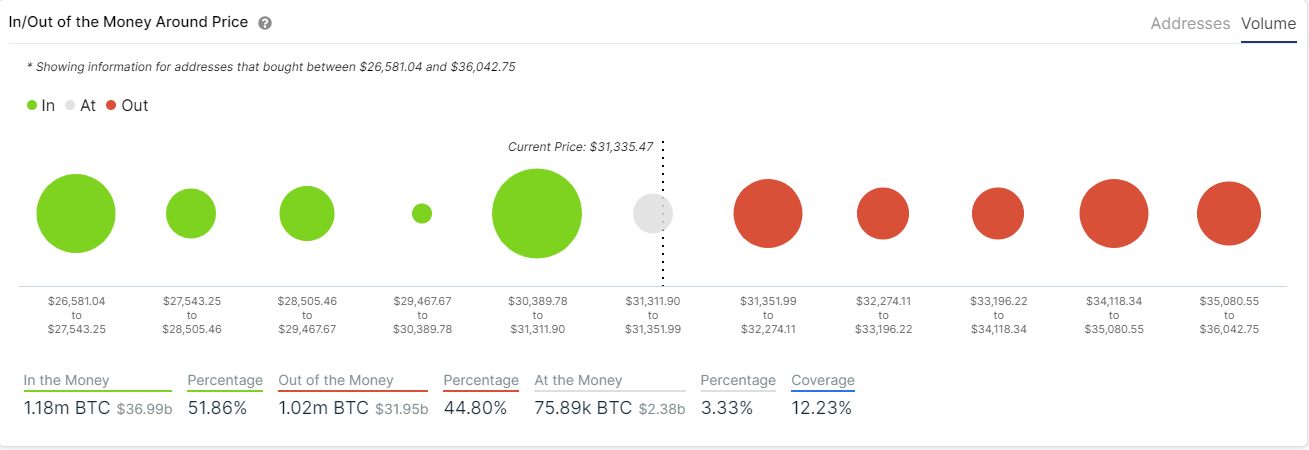
BTC IOMAP chart
Meanwhile, the In/Out of the Money Around Price (IOMAP) chart shows a robust support area between $30,300 and $31,300, where 614,000 addresses purchased over 506,000 BTC. A breakdown below this point would most likely take Bitcoin price down to the Slump level at $25,000.
However, the chart also indicates that resistance above $31,000 is scarce. The range between $31,300 and $32,300 is the strongest with 267,000 BTC in volume. A breakout above this area can drive Bitcoin price up to the next resistance level at $35,000.
Author

Lorenzo Stroe
Independent Analyst
Lorenzo is an experienced Technical Analyst and Content Writer who has been working in the cryptocurrency industry since 2012. He also has a passion for trading.


