Bitcoin Price Forecast: BTC/USD movement limited by strong support and resistance levels – Confluence Detector
- BTC/USD has a strong resistance level at $9,300.
- On the downside, healthy support lies at $9,200.

BTC/USD daily confluence detector
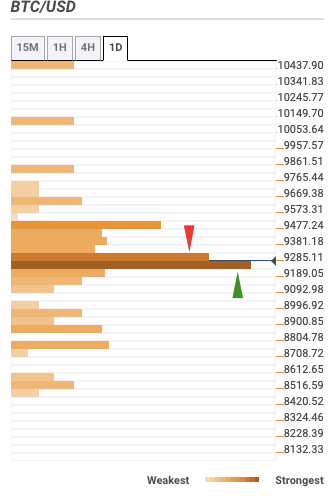
BTC/USD went down from $9,236.72 to $9,216.61 in the early hours of Friday. The price is sandwiched between strong support and resistance levels at $9,300 and $9,200, respectively.
The $9,300 resistance level has the 15-min Previous High, one-hour Previous High,4-hour Previous High, one-day Bollinger Band middle curve, one0week Pivot Point resistance-one, 15-min Bollinger Band upper curve, one-hour SMA 5, one-day SMA 5, 15-min SMA 50 and one-hour SMA 100.
The $9,200 support level has the one-day 23.6%, one-week 23.6% and one-month 23.6% Fibonacci retracement levels, 15-min Bollinger Band lower curve, 15-min Bollinger Band middle curve, 15-min Previous Low, one-hour Previous Low, 4-hour Previous Low, 15-min SMA 5,15-min SMA 10, one-hour SMA 10, one-day SMA 10, 4-hour SMA 50 and one-hour SMA 200.
Author

Rajarshi Mitra
Independent Analyst
Rajarshi entered the blockchain space in 2016. He is a blockchain researcher who has worked for Blockgeeks and has done research work for several ICOs. He gets regularly invited to give talks on the blockchain technology and cryptocurrencies.


