Bitcoin Price Forecast: BTC faces strong resistance at $10,800 – Confluence Detector
- BTC pioneer Max Keiser said that the coin is inversely correlated to the USD and not the stock market.
- The daily confluence detector shows one strong resistance level at $10,800.

Bitcoin is highly unlikely to drop below $6.7K – Analyst PlanB
Quant analyst PlanB recently took to Twitter to say that Bitcoin is highly unlikely to drop below $6,700. The analyst referenced the 200-week moving average (200MA) for BTC/USD to come to this conclusion. The 200MA has never been broken during Bitcoin price downtrends.
As long as historic behavior continues as it has done so far, $6,700 will now form a definitive price floor.
#Bitcoin 200 week moving average: $6700 pic.twitter.com/10ev8haKq8
— PlanB (@100trillionUSD) September 22, 2020
PlanB added that in March 2017, Bitcoin found it challenging to clear the vital $1,000 mark. However, after succeeding, the all-time highs of $20,000 arrived by the end of the year. After publishing the 200MA update, PlanB posted an online survey about future BTC price action. The survey attracted 14,000 responses.
Are you:
— PlanB (@100trillionUSD) September 22, 2020
- bitcoin or crypto?
- bullish or bearish BTC next 12 months?
The majority (59.2%) is bullish about Bitcoin over the next year. They also favor BTC over other cryptocurrencies. In total, over 92% of respondents are bullish when it comes to BTC/USD.
BTC pioneer says the coin is inversely correlated to the USD, not the stock market
Max Keiser, a BTC pioneer and analyst, recently noted that Bitcoin is not correlated to the stock market. Keiser’s comments came in response to a Twitter user who said that Bitcoin follows USD's movement. In the tweet, the user noted that “when stock markets go down, bitcoin gets pummeled.” Keiser responded that BTC is inversely correlated to the USD, not the stock market.
#Bitcoin, like Gild, is inversely correlated to the $USD - *not* the stock market.
— Max Keiser (@maxkeiser) September 22, 2020
Don’t be fooled by randomness https://t.co/UIbu7hiW5m
Keiser is not the only one who shares this opinion. Many Bitcoiners pointed to March 12 (Black Thursday) when digital assets crashed by nearly 40%. While global markets were also in the red, Bitcoin recovered and grew faster than stocks.
Markets.bitcoin.com data shows that BTC nearly doubled in value between March and September 2020. On March 21, Bitcoin traded at $5,792. On September 21, the leading digital asset sold at $10,499.
In comparison, the Dow Jones Industrial Average (DJIA) closed March 20 at 19,173 points. DJIA is the benchmark index in the US for blue-chip stocks. The same index closed September 21 at 27,147 points, representing a growth of 41.5% from March.
This data has convinced some Bitcoiners that the coin has an inverse relationship with fiat currencies such as the USD.
BTC/USD 12-hour chart
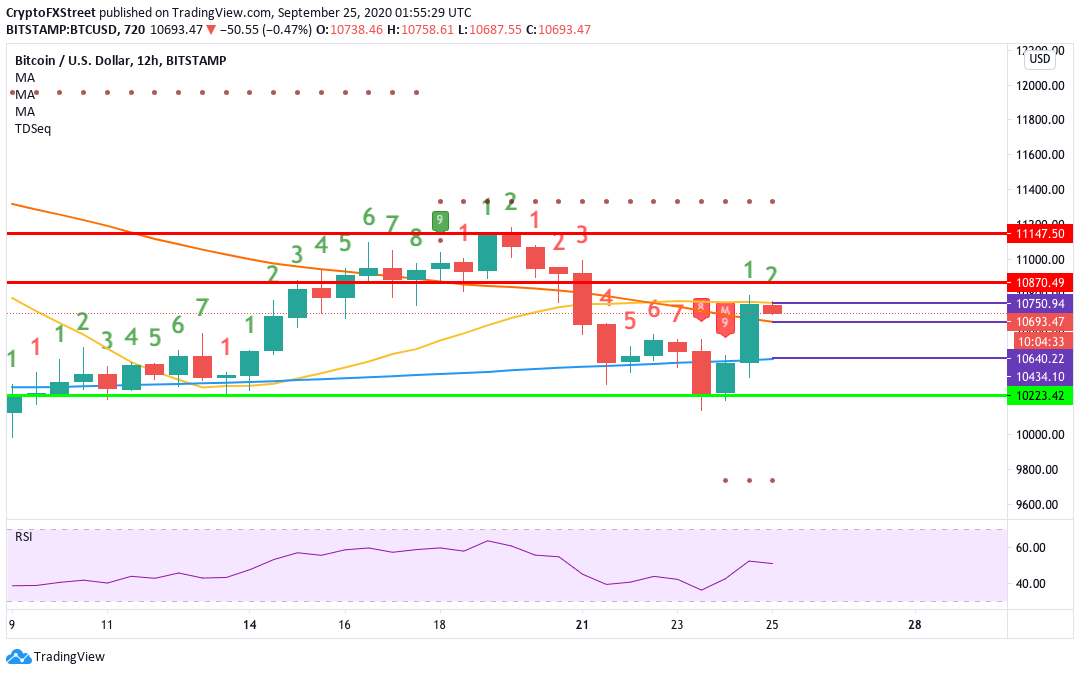
In the 12-hour chart, BTC/USD has dropped from $10,744 to $10,695 following two straight bullish sessions wherein the price bounced up from the $10,223.42 support line and breaking above the SMA 200 and SMA 50 curves. Currently, the price has met resistance at the SMA 20 and dropped down. The buyers will need to protect the support at the SMA 50 curve to prevent further downtrend.
BTC on-chain
#1 Age consumed
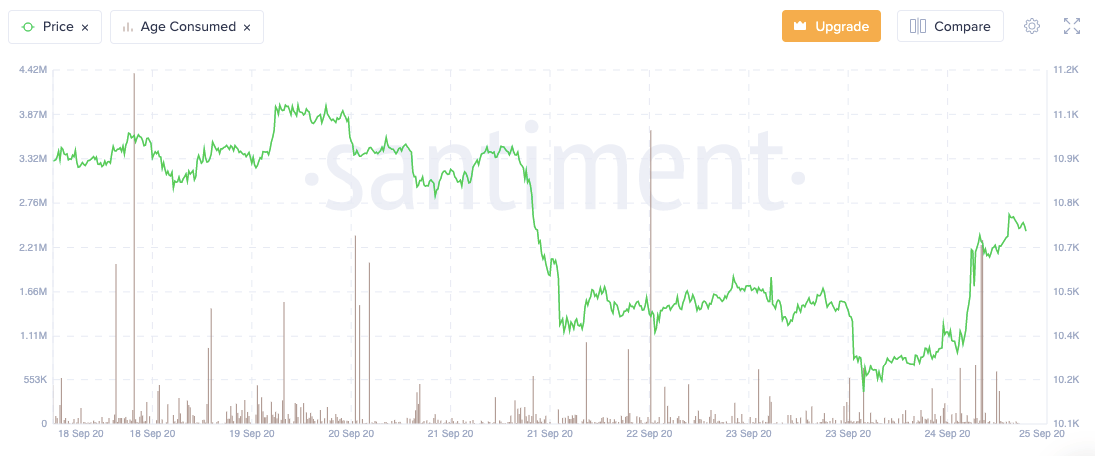
Sentiment’s “age consumed” is a useful metric that can help us predict any sharp price movement. As you can clearly see, there was a spike this Thursday where age consumed jumped up to 2.3M, which triggered an uptrend.
#2 New addresses
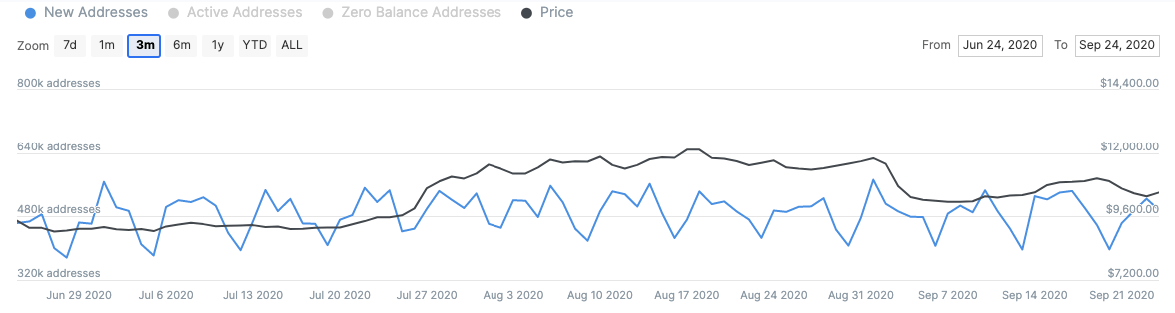
The number of new addresses entering the system has remained remarkably consistent over the last three months. The number of new addresses has flirted around 480,000 during this time period. There was a spike on 1st September 2020 in this period, wherein the new addresses entering the system rose up to 572.25k. The number of new addresses entering the system has a positive effect on the price. Since there has been no significant spike in new addresses entering the ecosystem in recent times, there has been no big spike in the price either. As of press time, around 495k addresses have been created, which pretty much fits this mold.
BTC daily confluence detector
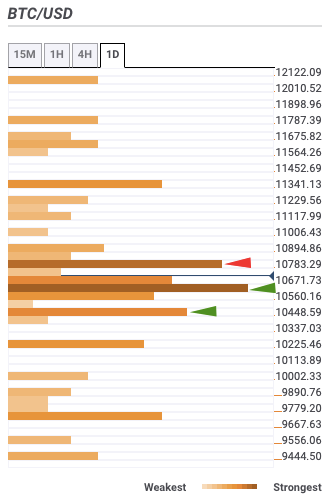
The daily confluence detector is a helpful tool that helps us predict the price movement of BTC. As per the tool, the premier cryptocurrency faces strong resistance at $10,800. This level has the one-hour Previous High.
On the downside, there are two healthy support levels at $10,600 - with the Previous Month low - and $10,500. These two support levels have enough juice to counter selling pressure. However, if the buyers break above the $10,800-level, the price should be able to cross the $11,000-level.
Author

Rajarshi Mitra
Independent Analyst
Rajarshi entered the blockchain space in 2016. He is a blockchain researcher who has worked for Blockgeeks and has done research work for several ICOs. He gets regularly invited to give talks on the blockchain technology and cryptocurrencies.