Bitcoin Price Forecast: Analyst predicts an explosive Q4 based on on-chain metrics
- Bitcoin must overcome resistance at $11,700 to continue the upward movement.
- On-chain metrics show that the number of addresses holding at least 1 BTC has been increasing steadily.

Over the last seven days, Bitcoin has enjoyed a bullish rally, jumping up from $10,600 to $11,500. However, it looks like the premier cryptocurrency is going to be enjoying even further gains as the year comes to a close. In a series of tweets, analyst Chris Russi explained why BTC is on the verge of exploding in Q4 of 2020.
18/ Bitcoin's Price Appearing More “Anti-Fragile” in face of:
— Chris Russi (@chrisrussi) October 13, 2020
-KuKoin getting hacked
-CFTC & DoJ filing charges against Bitmex
-Trump getting COVID
-FCA banning the sale of crypto-derivatives to retail consumers
All happened w/in ~3wk period, all w/ little effect on price
Bulls holding on to their tokens
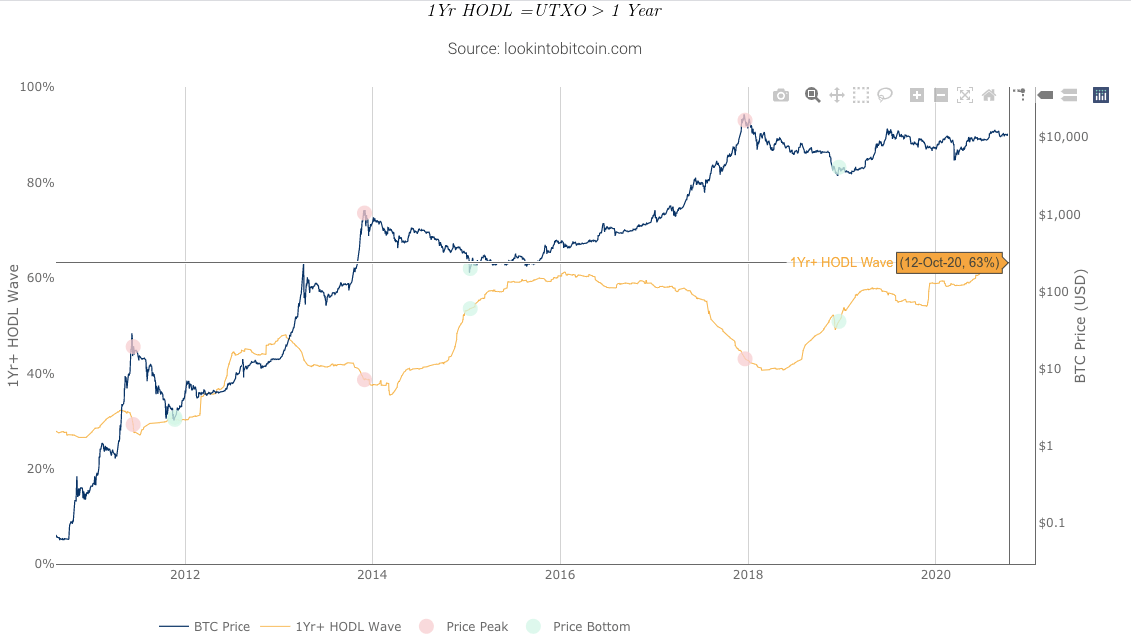
LookIntoBItcoin's 1Y+ HODL Wave chart allows you to look at the percentage of circulating supply that has not moved in over a year. As per the chart, 63% of all coins have remained dormant for at least one year.
This is the highest this number has ever reached and it shows that the users are holding on to their coins instead of selling them off.
LookIntoBitcoin’s 1 Year + HODL Wave
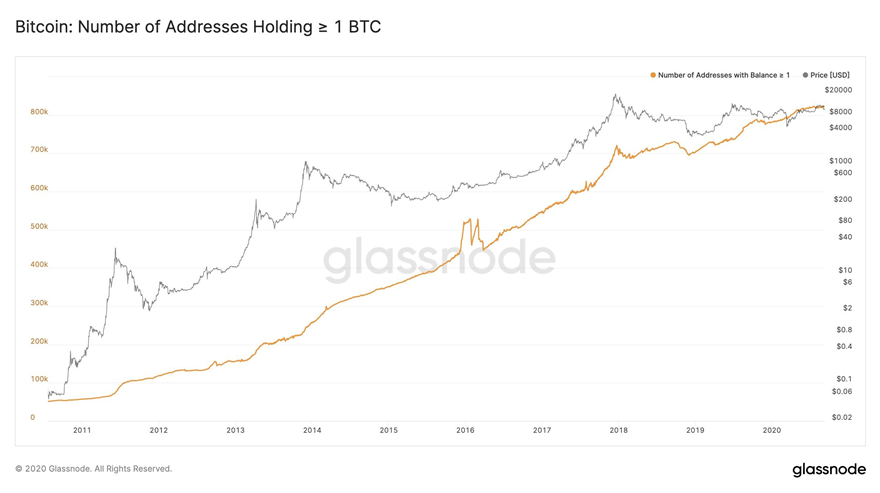
Plus, according to Glassnode, the number of unique addresses holding at least one BTC has been steadily increasing, posting new all-time highs. This is a very healthy sign, as it shows that Bitcoin’s network is growing steadily.
Number of addresses holding at least 1 BTC
The technical outlook
BTC is currently trapped between a strong resistance and support level, as defined by the IOMAP. The MACD shows increasing bullish momentum, so further growth movement can be expected.
BTC/USD daily chart
-637382406159572363.png)
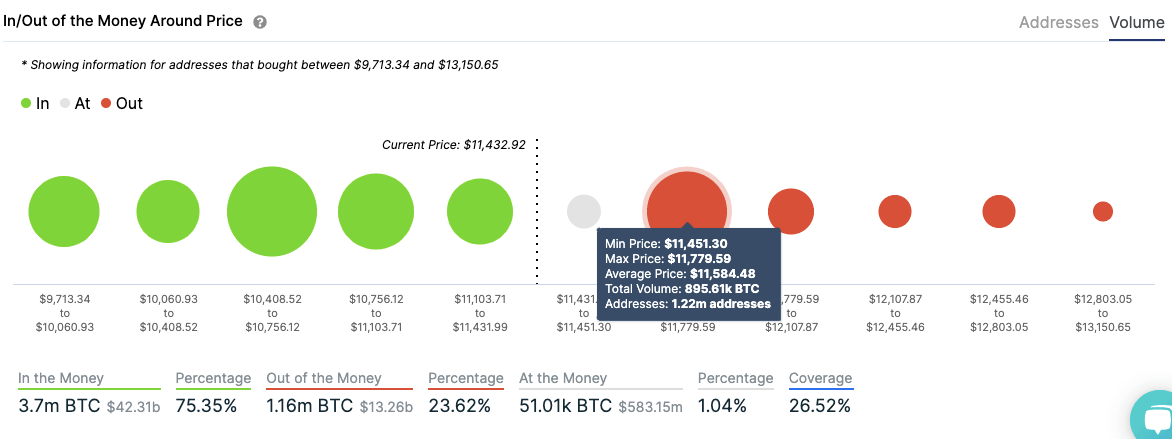
The daily chart shows a strong resistance at $10,700, which is currently pushing the price down. As per the IOMAP, 1.2 million addresses had previously purchased 895,000 BTC at this level.
BTC IOMAP
Upon conquering this resistance zone, the buyers will have enough momentum to push the price above $13,000.
The Flipside: Can the bears do any damage?
The number one cryptocurrency by market cap is currently sitting on top of three strong support walls, as shown in the IOMAP. The first support line lies at $11,300, wherein 1.12 million addresses purchased 540,000 BTC.
Following that, the next two healthy support walls lie at the 50-day SMA ($10,850) and the 100-day SMA ($10,750). They appear strong enough to absorb any selling pressure, effectively capping the downside at $10,750.
A drop below these support zones could be catastrophic as the next healthy support lies at the 200-day SMA ($9,700).
Key price levels to watch
Bitcoin bulls need to conquer the $11,700 resistance line to push the price into the $13,000 territory. The IOMAP shows a lack of strong resistance beyond this level.
If the bears take control, they will need to deal with three healthy support walls at $11,300, 50-day SMA ($10,850) and the 100-day SMA ($10,750). This effectively caps off the downside at $10,750.
Author

Rajarshi Mitra
Independent Analyst
Rajarshi entered the blockchain space in 2016. He is a blockchain researcher who has worked for Blockgeeks and has done research work for several ICOs. He gets regularly invited to give talks on the blockchain technology and cryptocurrencies.


