Bitcoin price could ‘probe lower’ as volumes dip and macroeconomic issues loom overhead

Bitcoin's sell-off appears to be taking a pause even though the United States rolled out new sanctions against Russia on Feb 22.
Data from Cointelegraph Markets Pro and TradingView shows that the price of Bitcoin (BTC) continues to hover slightly below $38,000, which some analysts have identified as a significant support and resistance zone.
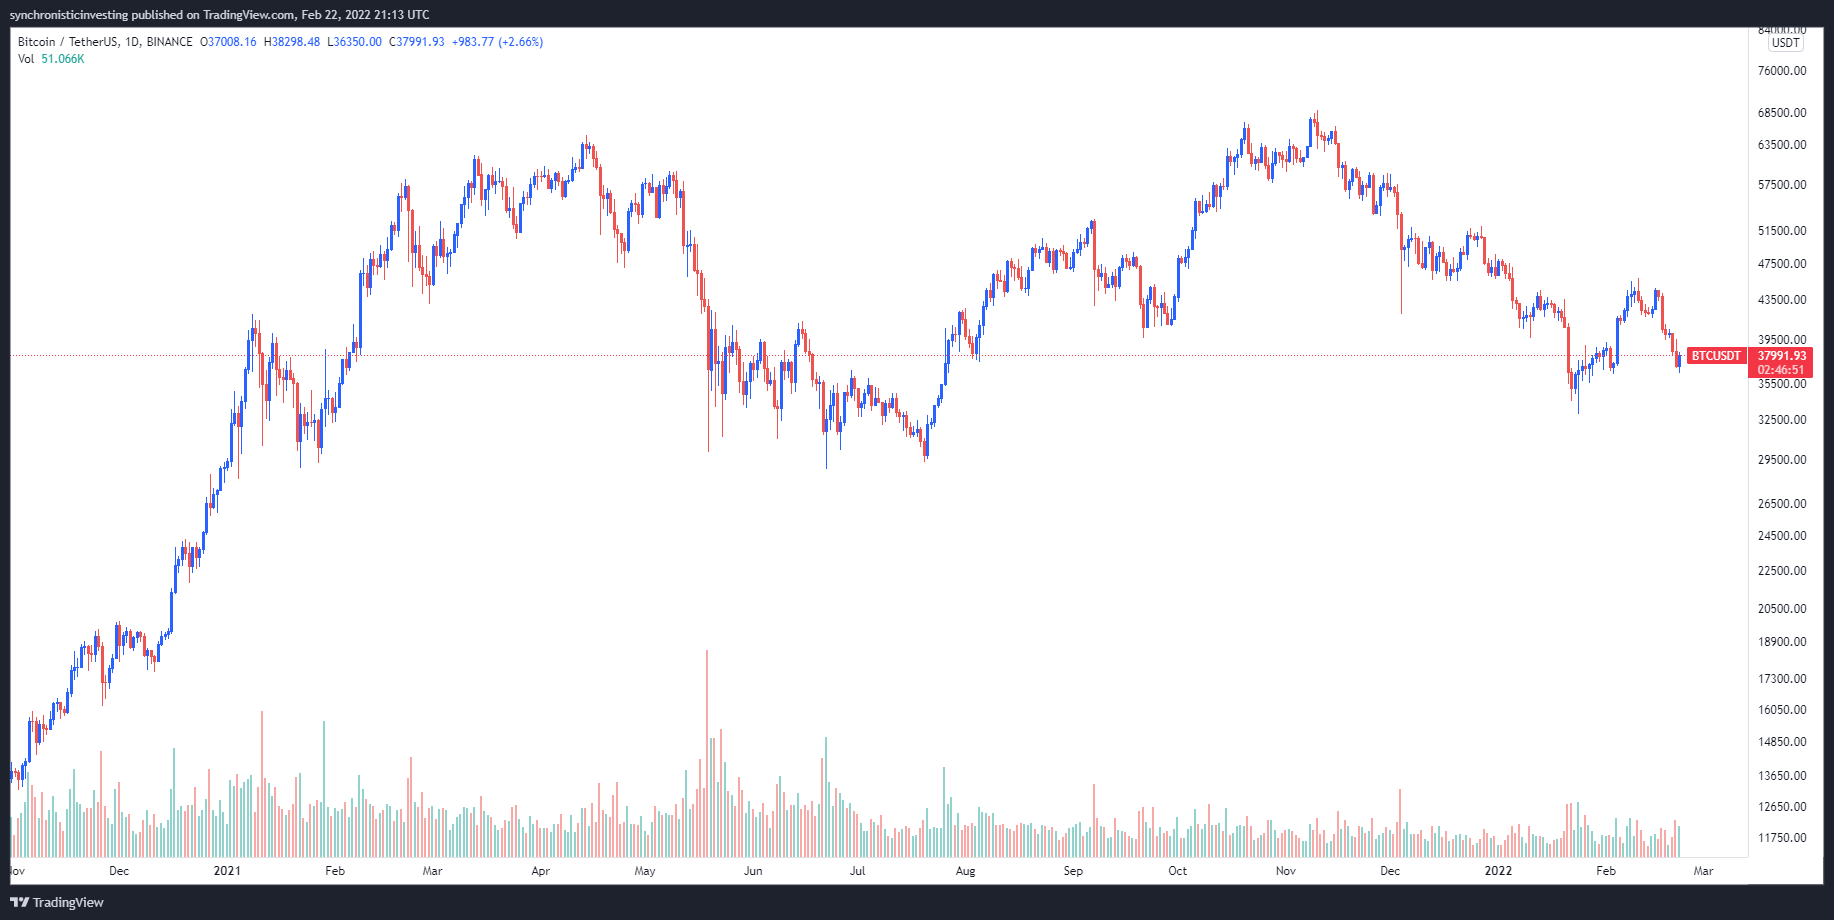
BTC/USDT 1-day chart. Source: TradingView
Here’s a closer look at what analysts are saying about Bitcoin price and what levels to keep an eye on in the short-term.
25% of entities are underwater
On-chain data outlet, Glassnode, posted the following chart analyzing the percentage of entities in profit and the analysts concluded “that the proportion of on-chain entities in profit is oscillating between 65.78% and 76.7% of the network.”
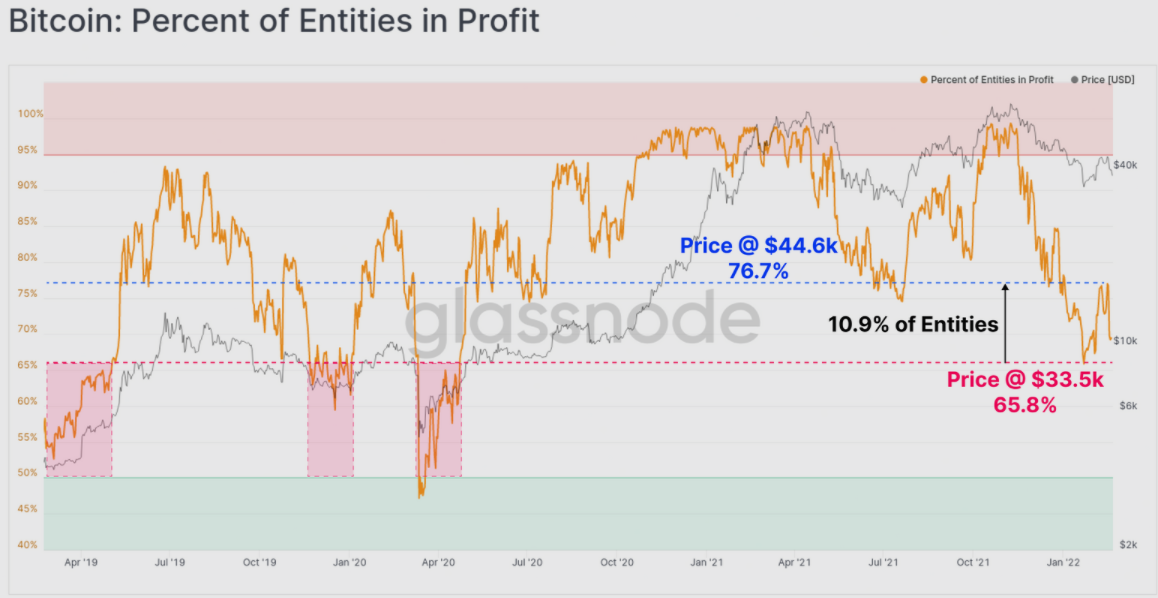
Percentage of entities holding Bitcoin that are in profit. Source: Glassnode
As shown in the chart above, “more than a quarter of all network entities are now underwater on their position,” while “approximately 10.9% of the network has a cost basis between $33,500 and $44,600.”
Glassnode said,
“If the market fails to establish a sustainable uptrend, these users are statistically the most likely to become yet another a source of sell-side pressure, especially if price trades below their cost basis.”
Price could continue to “probe lower”
Further insight into the headwinds facing BTC was provided by cryptocurrency research firm Delphi Digital, who previously noted that Bitcoin was “moving into an area of daily, weekly and monthly resistance.”
This confluence of resistance prompted Delphi Digital to suggest that “$45,000 was a logical place to expect profit-taking/risk reduction activity due to the confluence of resistance zones and the speed and magnitude of the move off recent lows,” which indeed turned out to be the case as the price dumped shortly after reaching that level.
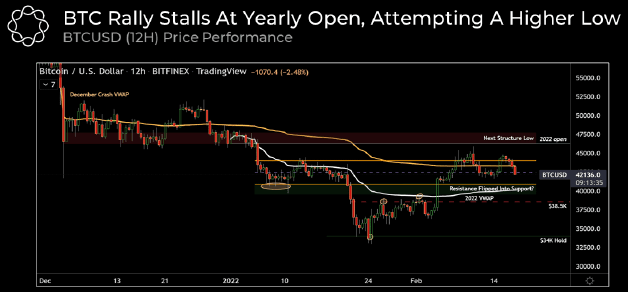
BTC/USD 12-hour chart. Source: Delphi Digital
According to Delphi Digital, the price of Bitcoin “has stalled for the last two weeks” and has yet to “reclaim any weekly support structure or the midpoint of the yearly range.”
Delphi Digital said,
“If the $40,000 level fails to hold, the next level of market structure is in the area of $38,500. Should we lose this level, you can expect prior lows to be revisited, with a decent likelihood of price probing lower.”
Whales look to accumulate below $38,000
A final bit of insight into the movement of Bitcoin whales was provided by on-chain analysis firm Whalemap, who posted the following chart highlighting areas where BTC wallets saw heavy inflows during the past four months.
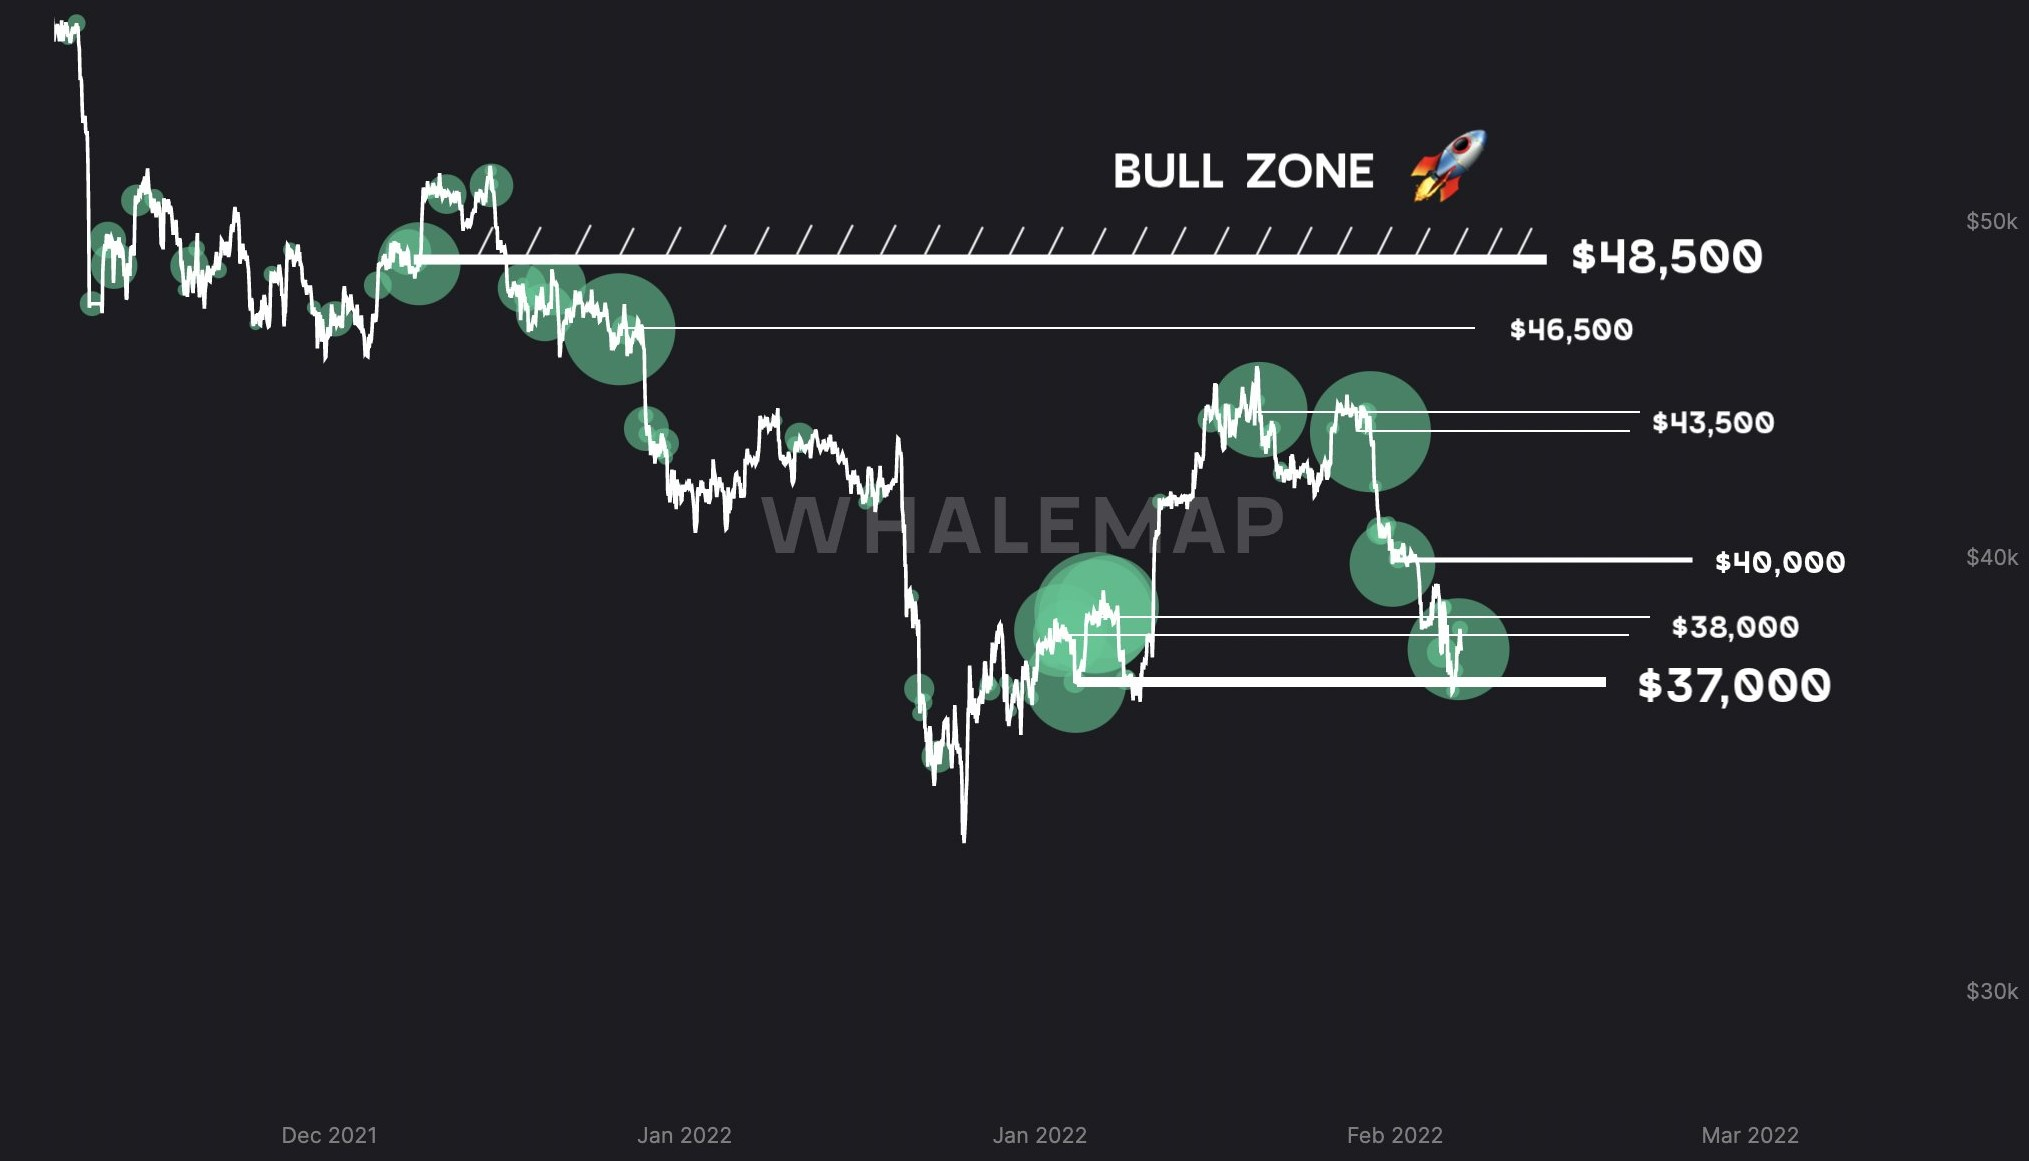
Large Bitcoin wallet inflows. Source: Whalemap
Whalemap said,
“Areas of whale interest are very well defined now. $34,000 awaits below $36,000-$37,000. Macro trend reversal above $48,500.”
Possible areas of resistance identified on the chart above include $40,000, $43,500, $46,500 and a major resistance level at $48,500.
A final bit of hope for BTC bulls was offered by Bloomberg Senior Commodity Strategist, Mike McGlone, who posted the following tweet suggesting that Bitcoin is currently on-sale relative to “its annual average since the 2020 and 2018 lows.”
The overall cryptocurrency market cap now stands at $1.708 trillion and Bitcoin’s dominance rate is 42.1%.
Author

Cointelegraph Team
Cointelegraph
We are privileged enough to work with the best and brightest in Bitcoin.



