Bitcoin price approaches overbought territory as technicals and on-chain metrics spell trouble – Confluence Detector
- Bitcoin network activity is not growing along with the price increase.
- Long-term charts show the market is on the verge of a correction.
- BTC may still retest an all-time high before the sell-off starts.

Bitcoin hit a new multi-year high of $18,488 on November 18. After the initial retreat to $17,200, the pioneer digital asset managed to settle above $18,000. However, the upside momentum seems to be fading away now.
While on the long-term time frames, the price continues moving within a clear upside trend, several on-chain metrics and technical indicators signify that a significant downside correction may be underway.
At the time of writing, BTC/USD is hovering around $18,200. The coin has gained nearly 4% on a day-to-day basis and 11% on a weekly basis. Bitcoin's market capitalization increased to $330 billion, while its average daily trading volumes reached $37 billion.
Daily Active Addresses metrics create a massive bearish divergence
As the chart below shows, Bitcoin's daily network activity has been receding even though the price moved upwards. This trend led to a significant divergence between the Daily Active Addresses (DAA) and the price momentum. Moreover, the increasingly long red candles signal that the pressure is building up at least since the beginning of October, and the correction may be really severe once it starts. As the indicator does not tell when the price may reverse to the downside, another leg up can be seen before the sell-off begins.
 [13.05.10, 20 Nov, 2020]-637414658510065024.png)
Daily Active Addresses vs. Price Divergence
If the history is any guide, the price may sump by 30-40% and retest $12,500 before another bullish wave starts and take BTC to new all-time highs. Read a more detailed analysis of the historical Bitcoin movements here.
Bitcoin TD Sequential indicator ready to send sell signals
From the technical point of view, BTC is grossly overbought on the long-term time frames. Both weekly and monthly charts contain a green eight candlestick, which is a precursor of a sell signal, produced by a green nine candlestick.
If the sell signal is confirmed, BTC may start a downside correction in the form of one to four red candlesticks, meaning that December 2020, and potentially January 2021, may become less successful months for Bitcoin bulls.
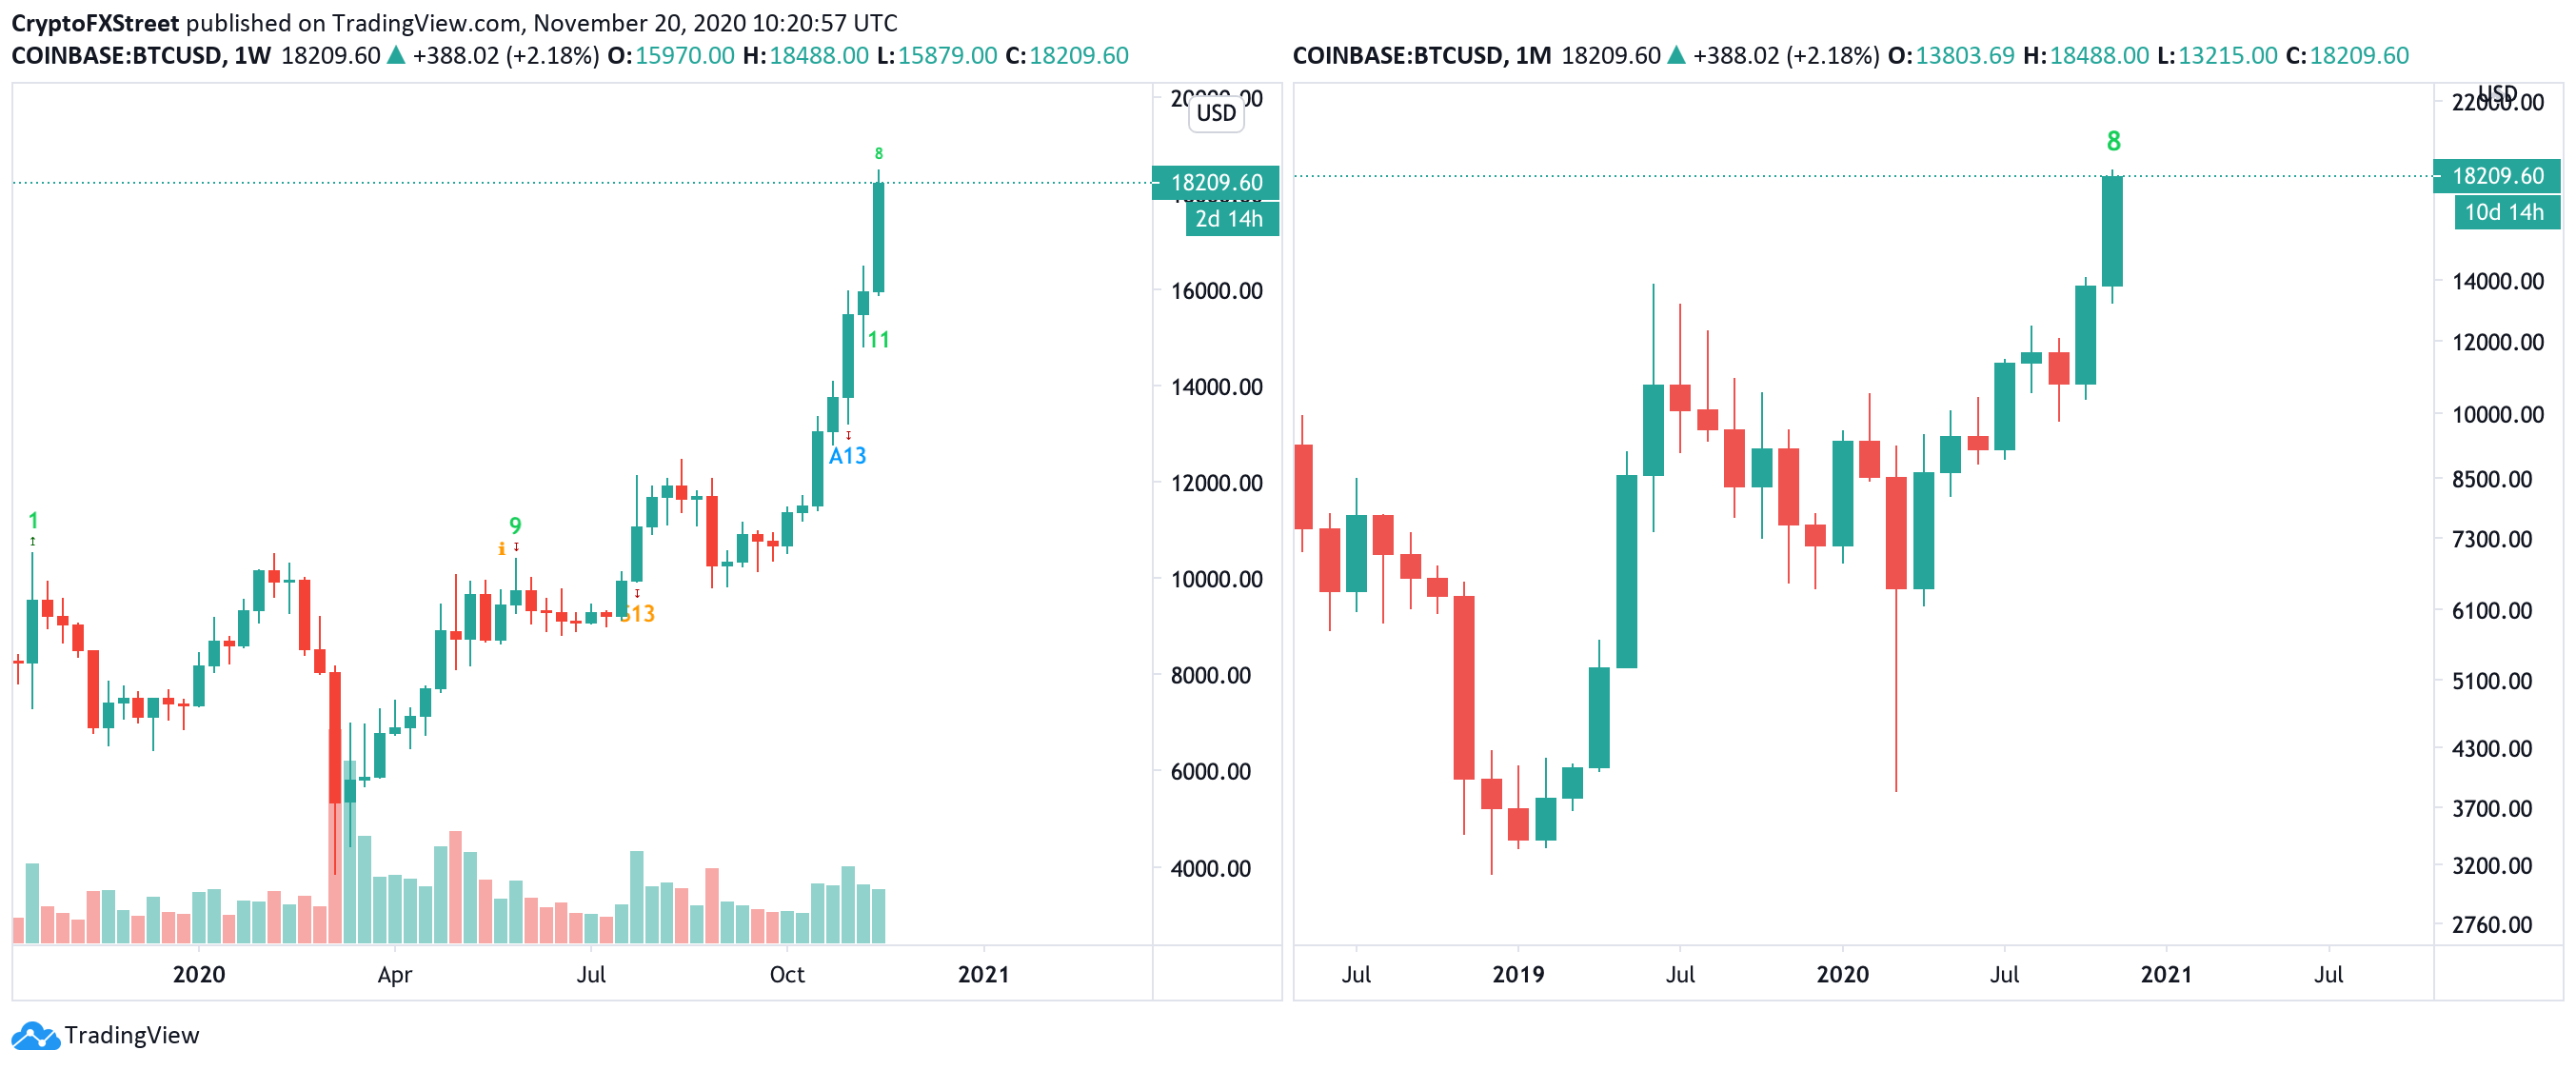
BTC/USD weekly and monthly charts
It's worth noting that a sell signal on the weekly chart will come in two days, while on the monthly one will take 10 days to finish. This means that Bitcoin still has time to retest new highs before the correction starts.
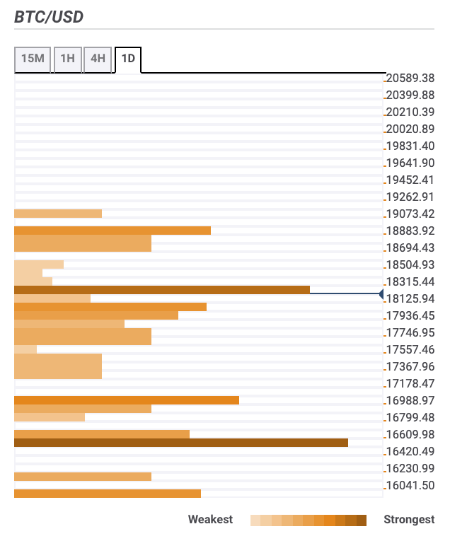
Bitcoin Confluence levels
Bitcoin's daily confluence chart shows several clusters of support levels on the way down. The first local barrier comes on approach to $18,000 with 23.6% Fibonacci retracement level daily. Once it is broken, the sell-off may gain traction with the next focus on $17,000, reinforced by Pivot Point 1-day Support 2 and the Pivot Point 1-week Resistance 1. However, critical support is seen at $16,500. It is created by a previous week high and a Pivot Point 1-month Resistance 2. A sustainable move below this area may become a trigger for a long-term correction.
On the upside, the local barrier is seen on approach to $18,00, the upper line of the daily Bollinger Band and Pivot Point 1-day Resistance 1. Once it is out of the way, the upside is likely to gain traction, with the next focus on the recent high of $18,488.
Author

Tanya Abrosimova
Independent Analyst


