Bitcoin Price Analysis: Why BTC/USD is tumbling despite COVID-19 uncertainty – Confluence Detector
- Bitcoin price nosedives under $9,000; extending the breakdown from the rejection at $10,000.
- Investors continue considering another safe-haven alternative to gold: Will Bitcoin make the cut?

Bitcoin price continues to drum in the negative direction despite efforts by the buyers to break the stubborn resistance at $10,000. In the last 48 hours alone, BTC/USD has tumbled below several key support areas including $9,500, $9,250 and $9,000. Luckily, there were buyers waiting to buy low after Bitcoin quickly rushed towards $10,000 in the wake of its reward halving. A new weekly low has been traded at $8,750 but Bitcoin has already reclaimed the position above $8,900. An intraday high has been formed at $9,124 (a new seller congestion zone).
Can Bitcoin replace gold as the ultimate safe-haven asset?
Bitcoin is tumbling amid calls for it to stand out as the ultimate safe haven in pandemic situations such as the crippling COVID-19. Investors around the world are alarmed by the shocks the stock markets will have to endure amid an almost certain global economic crash. Inflation is set to skyrocket as central banks continue with money printing to cushion the economies from potential falls.
There is also a theory that central banks could push for a policy that outlaws private ownership of gold in order to control inflation. For this reason, Bitcoin remains the most viable alternative to gold as a safe-haven asset. However, Bitcoin is struggling to hold an uptrend and is likely to continue with the dive to $8,000.
Bitcoin confluence resistance and support levels
Resistance one: $9,027 – A seller congestion zone highlighted by the Fibo 23.6% one-day, the Bollinger Band 15-minutes and the previous high 15-minutes.
Resistance two: $9,120 – Home to the previous high 4-hour, the Bollinger Band 1-hour middle curve and the SMA five 4-hour.
Resistance three: $9,494 – This zone hosts the previous month high, the pivot point one-day resistance one and the Bollinger Band 4-hour middle curve.
Support one: $8,840 – A buyer congestion zone highlighted by the previous low one-day, the Fibonacci 38.2% one-week and the Bollinger Band 1-hour upper.
Support two: $8,747 – Is the region hosting the pivot point one-day support one and the Fibo 23.6% one-month.
Support three: $8,560 – Highlighted by the Fibo 23.6% one-week.
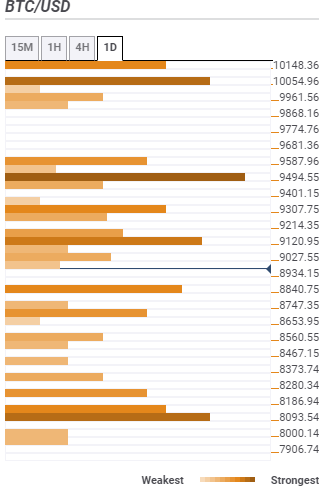
Bitcoin intraday key levels
Author

John Isige
FXStreet
John Isige is a seasoned cryptocurrency journalist and markets analyst committed to delivering high-quality, actionable insights tailored to traders, investors, and crypto enthusiasts. He enjoys deep dives into emerging Web3 tren



