|

Bitcoin price analysis: Short term breakout is here, 100 SMA is a first test

  • Bitcoin breaks out of a trendline resistance on the short term chart.
  • Faces resistance at 100 days SMA.

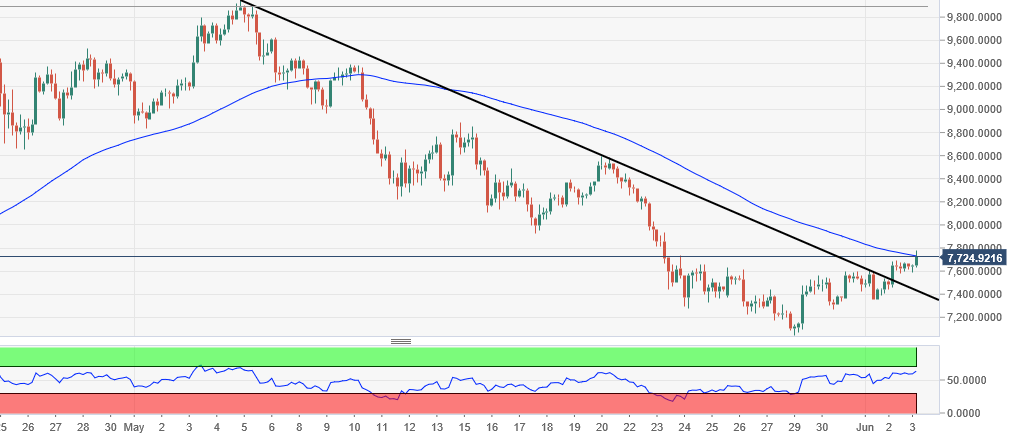
Bitcoin, the poster boy of cryptocurrencies, has broken out of a falling trendline resistance on the short term charts and is trading well above it, but has a first test to pass in the form of 100 days simple moving average.

BTC/USD is up more than a percent at $7,722 after hitting day's low of $7,587. BTC bulls have managed to sustain past a falling trendline resistance on the 240-minute chart, as pointed by this author on Saturday (read earlier story here) and now faces first test in the form of 100 days simple moving average sitting just where the price is - $7,731.

Once crossed, BTC's next major resistance is around the round figure mark of $8,000 and then $8,600. Strong support is placed around $7,000 mark.

BTC/USD 240-minute chart:
Author

Manoj B Rawal

Manoj B Rawal

Independent Analyst

Manoj B Rawal, financial markets professional with about 11 years of experience in writing, editing and advising on stocks, currencies and fixed income.


More from Manoj B Rawal
Share:

Editor's Picks

Has Bitcoin really escaped the macro forces it was built to fight?

Over 17 years ago, Satoshi Nakamoto designed Bitcoin on the back of a global financial crisis as an alternative to the global monetary system outside the control of central banks, governments and traditional intermediaries. This raises a key question: has Bitcoin really become independent of the macroeconomic forces it was built to challenge?

Ethereum activates Glamsterdam on Sepolia testnet: Why the price is falling anyway

Ethereum (ETH) has reached a key milestone in its next major network upgrade. The planned changes aim to improve Ethereum’s Layer 1 capacity and efficiency as network activity grows. The development comes as ETH retreats toward $2,500.

Bitcoin Weekly Forecast: Uptober or Rektober?

Bitcoin (BTC) price is down over 4% so far this week, trading below $83,000 at the time of writing on Friday as mounting selling pressure threatens to derail the seasonal “Uptober” rally. Profit-taking, a surge in long liquidations and weakening demand from institutional investors are weighing on BTC.

Ripple bulls gather recovery momentum amid returning ETF inflows

Ripple (XRP) trades largely in bearish hands on Friday near $1.40. Although the remittance token has stabilized after a sharp sell-off from weekly highs of $1.53 to lows around $1.32, the path of least resistance remains downward, unless buyers affirm a daily close above the pivotal $1.40 level.

Bitcoin: Uptober or Rektober?
Bitcoin (BTC) price is down over 4% so far this week, trading below $83,000 at the time of writing on Friday as mounting selling pressure threatens to derail the seasonal “Uptober” rally. Profit-taking, a surge in long liquidations and weakening demand from institutional investors are weighing on BTC.

