Bitcoin price analysis: BTC/USD is set to test very key trend line again, a break could see large selling
- BTC/USD subject to testing and potentially breaking a key supporting trend line.
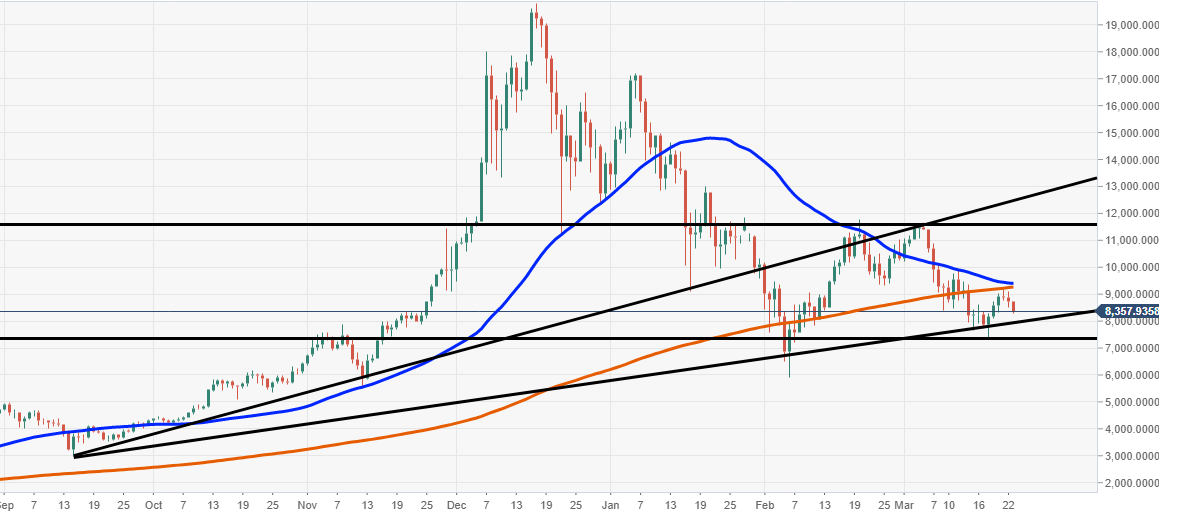
- Major support seen at $8,000, a breach could see $6,000 targeted again.

The Bitcoin price is seen down almost 5% on Friday, as they market resumes its move to the downside, failing to maintain its path to recovery. Bitcoin had looked to be setting up a decent pullback at the beginning of the week, after hitting lows on 18th March at $7,400.
Momentum is firmly back within the bears territory, after giving up and closing below $9,000. The theme of FUD continues, as soft news does the rounds. Bitcoin has respected both the 50 and 200 DMAs, failing to push back above this week. Eyes are still on a potential death cross, where the 50DMA would cross over the 200DMA.
Technically, viewing the daily time frame, BTC/USD is heading towards a supporting ascending trend line, running from September, which caught the price during the extreme lows in February seen just below $6,000. Support is tracking at $8,000, a breach could see this fall back towards $6,000.
BTC/USD daily chart
Author

Ken Chigbo
Independent Analyst
Ken has over 8 years exposure to the financial markets. He started his career as an analyst, covering a variety of asset classes; forex, fixed income, commodities and equities.


