Bitcoin Price Analysis: BTC/USD is hanging on by a thread, as key near-term support is being tested
- Bitcoin price on in the latter stages of trading on Monday was hammered, dropping almost 4%.
- BTC/USD has very shaky legs, as the bears continue to press a key near-term supporting ascending trend line.

The Bitcoin price was seen trading firmly in the red on Monday, coming under quite some selling pressure in the latter stages of the session. Bears appear to be on a mission to take out the very key near-term support.
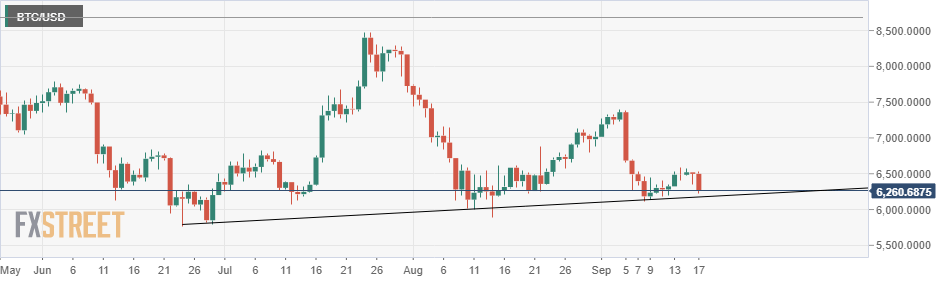
BTC/USD price action has been supported since the back-end of June, by an ever so gradual ascending trend line. The market bears have already tested this line on several occasions, however the pressure has intensified through the month of September, raising its vulnerabilities to a break lower.
Technically, immediate support for BTC/USD is as mentioned seen at the below trend line, support currently tracking at $6185, a breach could see a fast money move below $6000, next demand zone eyed at $5900-800 area. Resistance to the upside still looks tough from $6500-600.
BTC/USD daily chart
Author

Ken Chigbo
Independent Analyst
Ken has over 8 years exposure to the financial markets. He started his career as an analyst, covering a variety of asset classes; forex, fixed income, commodities and equities.


