Bitcoin Price Analysis: BTC/USD bulls take charge after charting the golden cross pattern
- BTC/USD dropped below the SMA 20 following Friday’s price action.
- The MACD shows increasing bearish momentum.

BTC/USD daily chart
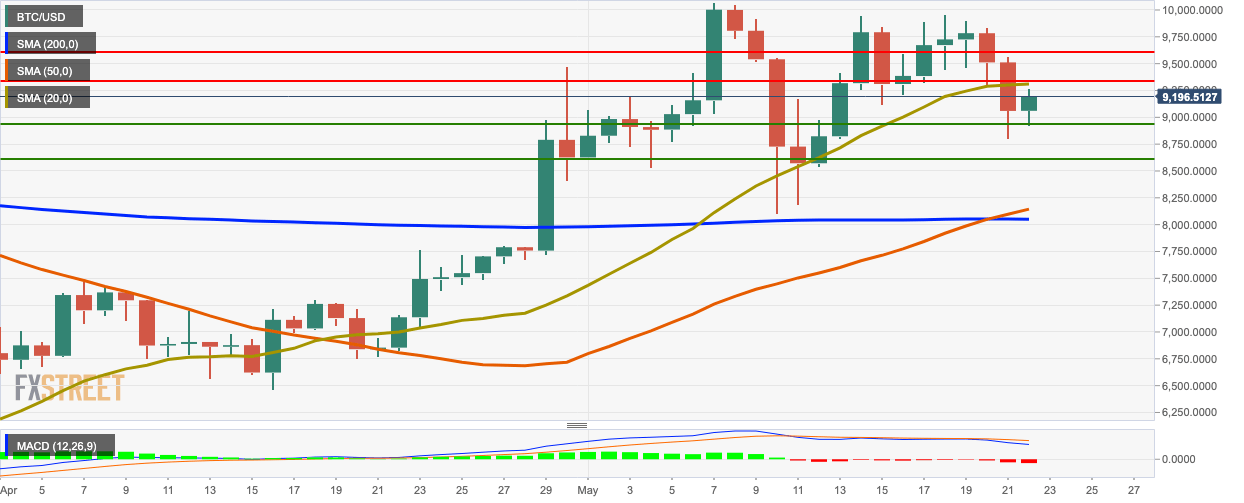
BTC/USD bulls took charge as the price moved up from $9,060.80 to $9,178.70 this Friday. This price action happened after the SMA 50 crossed above the SMA 200 to chart the highly bullish golden cross pattern. The MACD shows increasing bearish momentum.
The bulls need to overcome resistance at the SMA 20, $9,332.15 and $9,621.35. On the downside, healthy support lies at $8,935 and $8,629.55,
Key levels
Author

Rajarshi Mitra
Independent Analyst
Rajarshi entered the blockchain space in 2016. He is a blockchain researcher who has worked for Blockgeeks and has done research work for several ICOs. He gets regularly invited to give talks on the blockchain technology and cryptocurrencies.
More from Rajarshi Mitra


