Bitcoin Price Analysis: BTC/USD bulls smash out of pennant structure
- Bitcoin price is trading in positive territory, up 7.50% in the second half of the session.
- The bulls successfully held above the $6000 territory, with a recent push above $6500.
- A breakout from a narrowing range has invited an opportunity to drive higher.

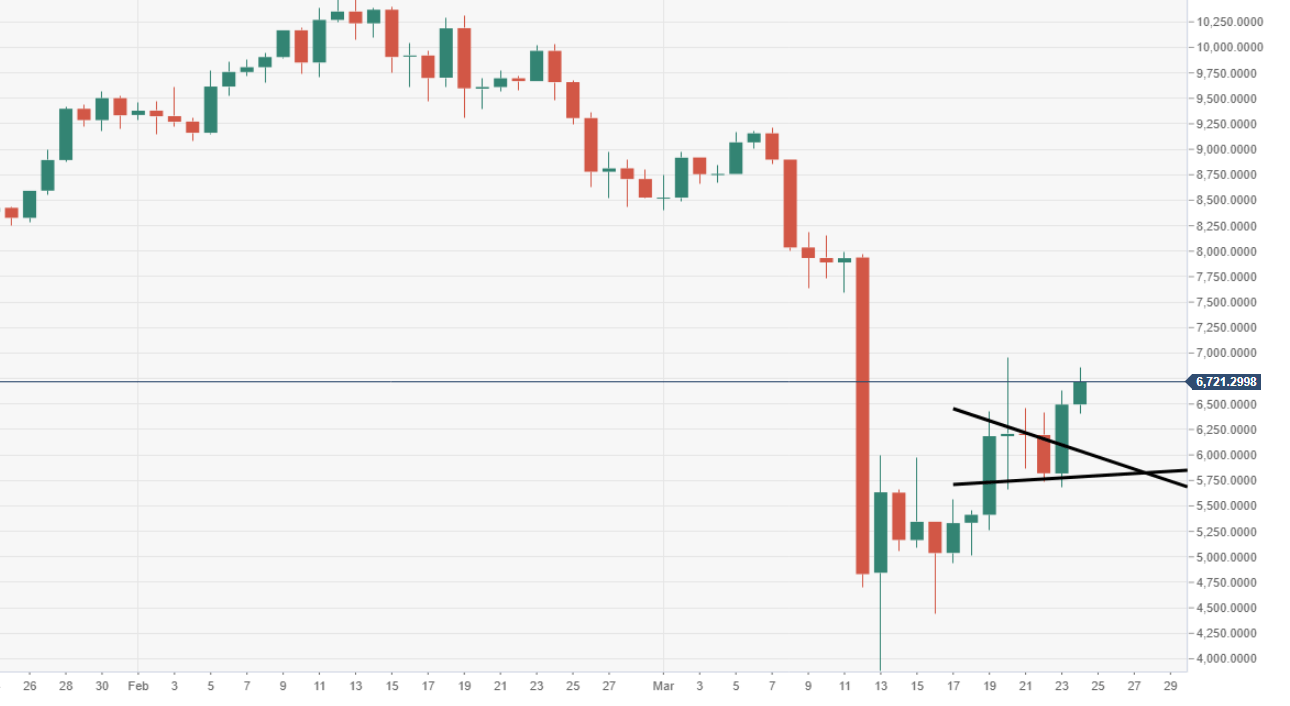
BTC/USD daily chart
Price action had formed a bullish pennant between 19-23 March, of which the bulls have forced a breakout to the upside.
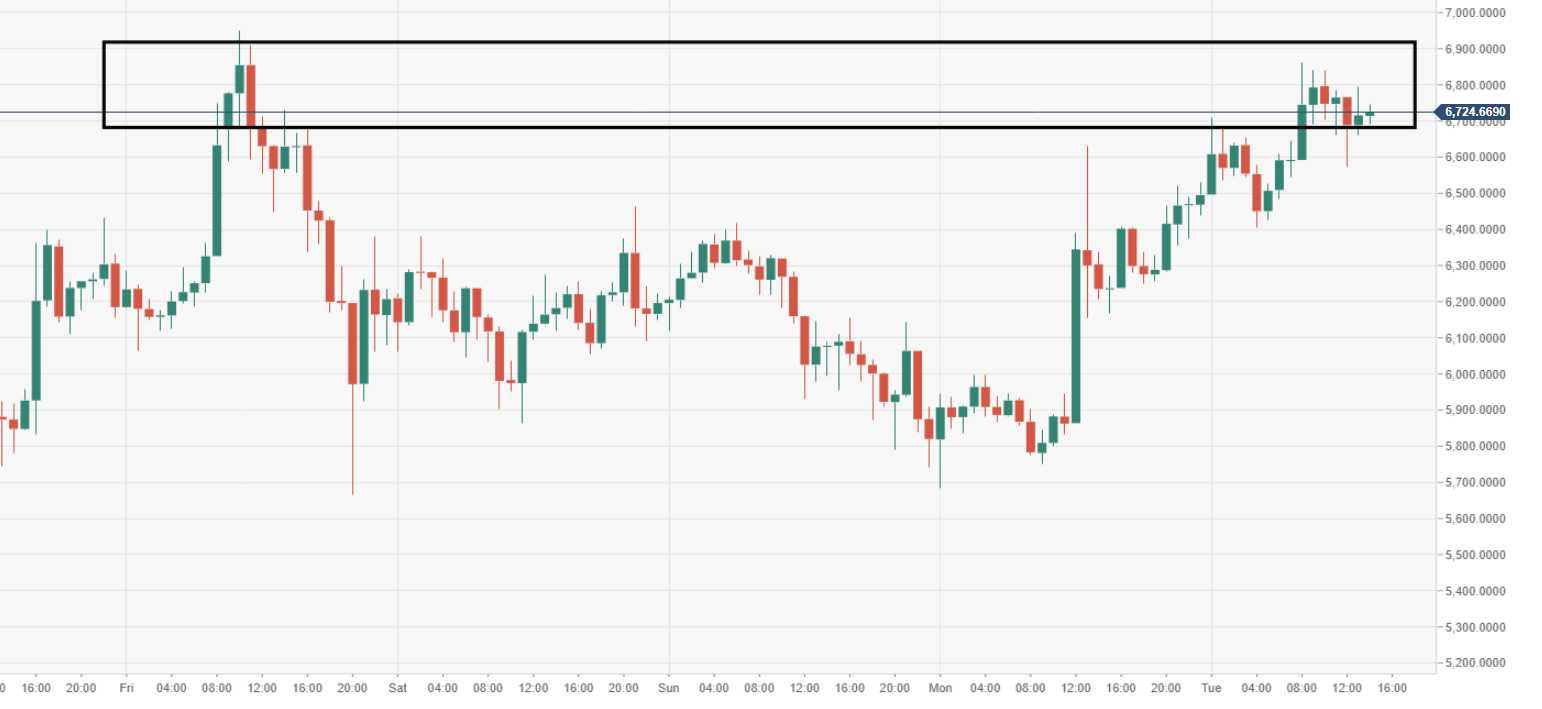
BTC/USD 60-minute chart
The next 60-minute zone of resistance is eyed at $6800-900 price range.
Spot rate: 6725.10
Relative change: +3.50%
High: 6861.94
Low: 6403.85
Author

Ken Chigbo
Independent Analyst
Ken has over 8 years exposure to the financial markets. He started his career as an analyst, covering a variety of asset classes; forex, fixed income, commodities and equities.
More from Ken Chigbo


