Bitcoin price analysis: BTC/USD breaks out of key supporting ascending channel, here come the bears
- Bitcoin price down again on Wednesday, nursing losses of 1.5%, as price breaks key supporting channel.
- Next support areas to note; $7,200, 18th March low and then buying area within mid $6,000 region.

The Bitcoin price is seen down 1.5% on Wednesday, with the current bearish trend seen this week, starting to look like the norm for now. Selling pressure remains firmly evident across the board, as some believe the 2017 sell-off was never over.
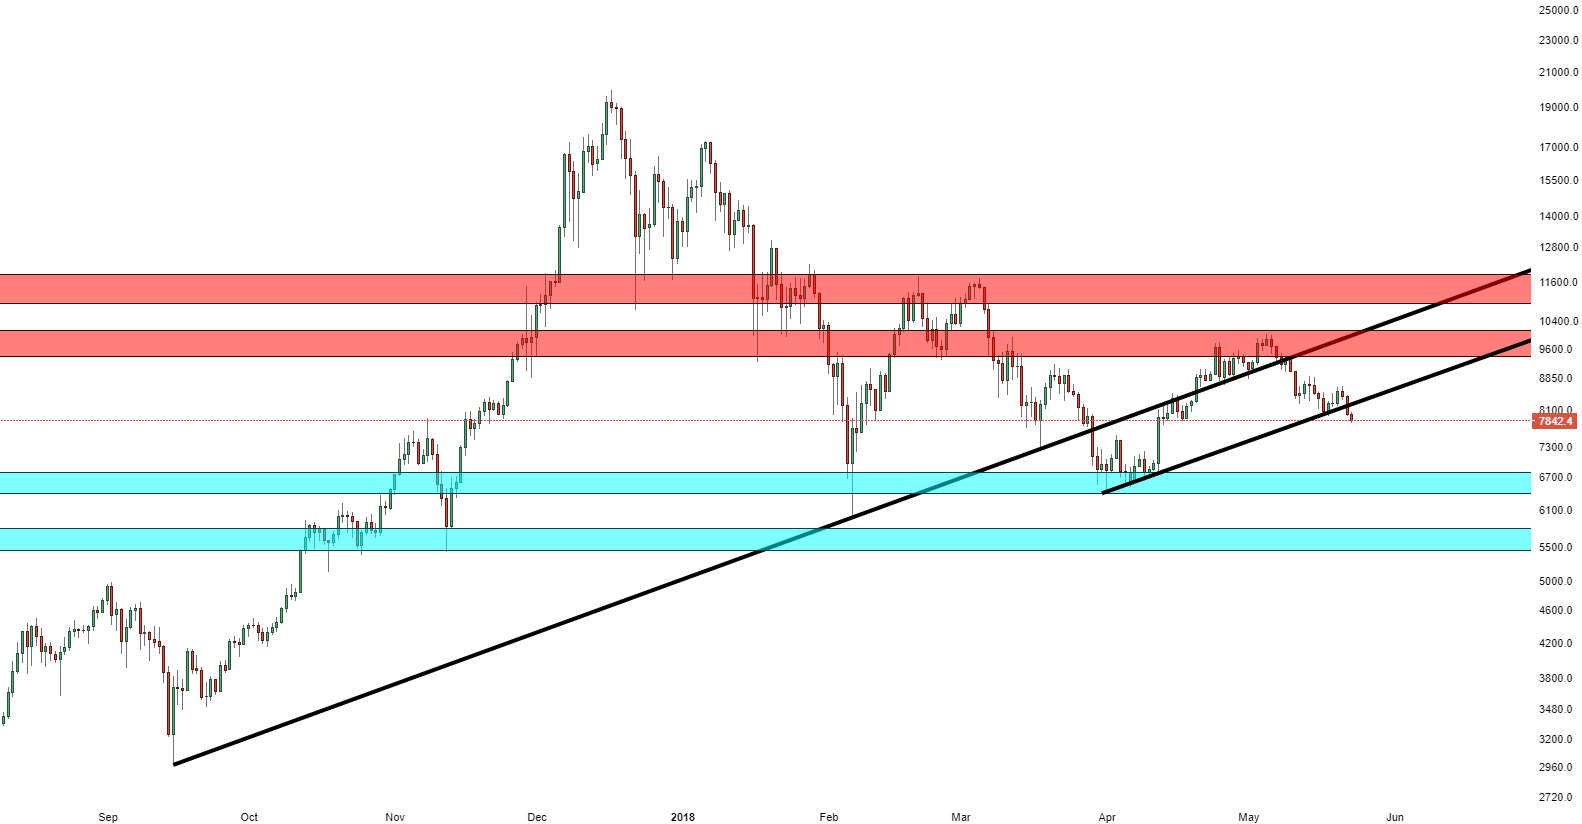
BTC/USD made a daily close below the underlying trend line of a supporting channel pattern, given this development, it was quite inviting for further bears to join in on the action. The daily candlestick on Wednesday, has further moved away to the south from the exposed trend line, indicating the selling pressure may not be done yet.
Technically, BTC/USD remains very much vulnerable to a resumption of the downside trend. Given recent breakthrough, next support is seen at $7,200 the low of 18th March. Further to the downside would be the buying area within the mid $6,000 region, last here at the start of April. Resistance to the upside will now be the initially supporting trend line of the channel at $8,300.
BTC/USD daily chart
Author

Ken Chigbo
Independent Analyst
Ken has over 8 years exposure to the financial markets. He started his career as an analyst, covering a variety of asset classes; forex, fixed income, commodities and equities.


