Bitcoin Price Forecast: BTC whales plotting a bullish attack
- A cluster of technical resistance levels limits BTC/USD recovery.
- On-chain metrics imply that the coin may be ready for a decisive breakthrough.

Bitcoin (BTC) is changing hands at $10,750, mostly unchanged since the start of the day. The cryptocurrency attempted a recovery to $11,000 on Monday but was thrown back inside the range by aggressive short-term sellers. BTC/USD has lost over 1% in the last 24 hours; however, it is still nearly 3% higher on a week-on-week basis.
Bitcoin's market value has settled at $198 million, which is 56.9% of the total capitalization of all digital assets in circulation.
BTC/USD: The technical picture
On a daily chart, BTC/USD is moving along the upside-looking trend since the low reached at $9,819 on September 8. The bulls got inspired by a higher low, followed by a bullish engulfing candle. However, the further upside stuck on approach to $11,000.
Several days of consolidation below this psychological barrier have not yielded decisive breakthrough attempts, signaling that the market may be intimidated by the vital resistance area that starts at $11,000 and goes all the way up to $11,200.
A sustainable move above this area will bring $11,800 and $12,000 into focus and allow for an extended recovery towards the highest level of 2020 at $12,500.
BTC/USD daily chart
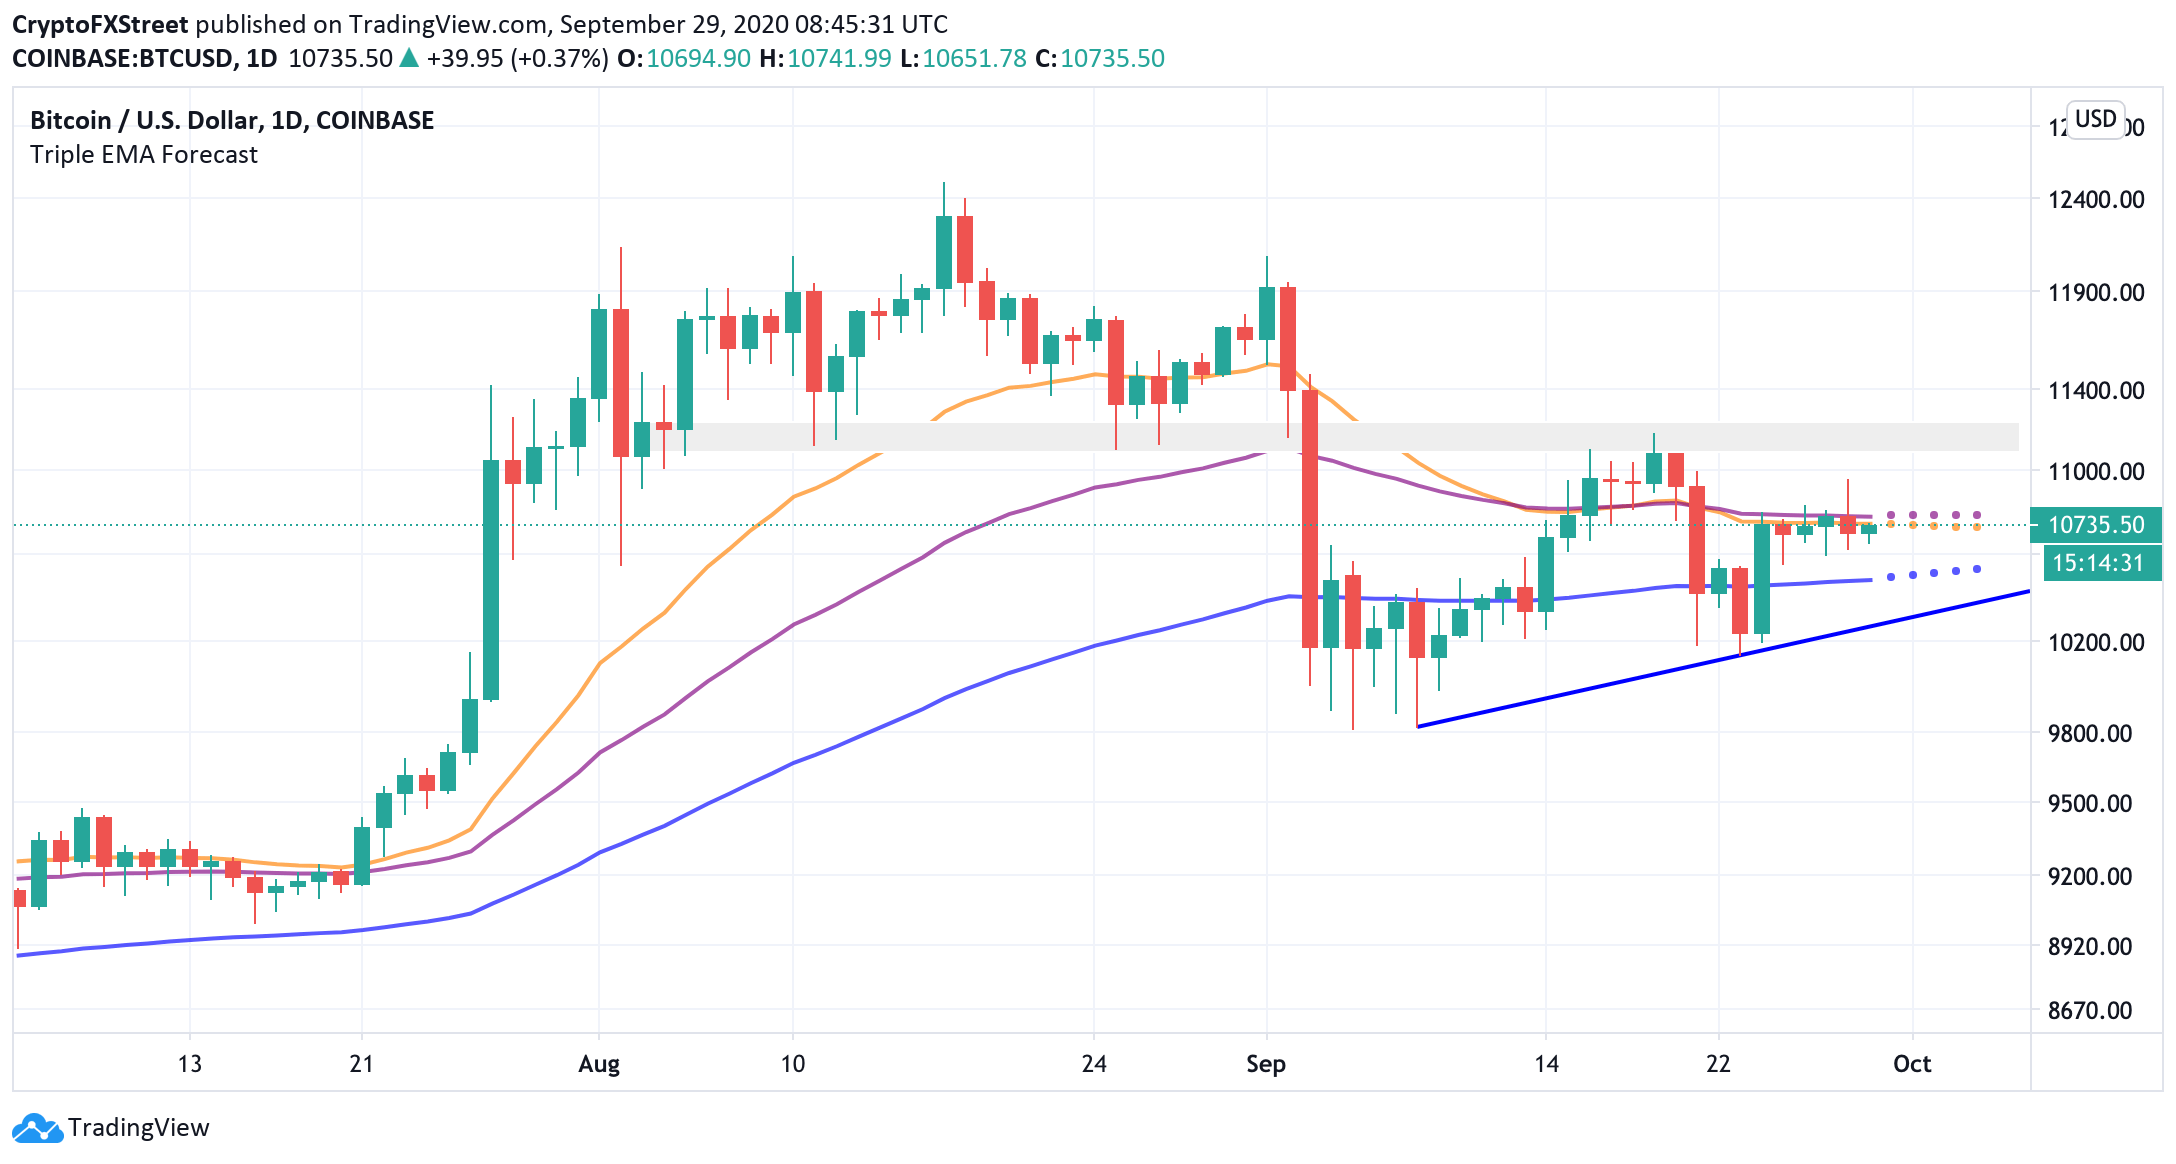
A cluster of the daily SMA50 and SMA100 above the current price serves as an additional hurdle on the way to the North. The technical picture implies that BTC may continue moving inside the current range or retreat to $10,500. This barrier served as resistance after Bitcoin's collapse at the beginning of September. Now it is verified as a support area.
The ultimate bearish target comes on approach to the upside-looking trendline currently at $10,300. A move below this area will signal that the downside correction is gaining traction and bring new sellers to the market. In this case, BTC may revisit $9,000 before the next upside wave.
On-chain data paints a different picture
Meanwhile, the on-chain data implies that BTC bulls are getting ready for a massive assault. The spike on the Age Consumed chart indicates a sudden growth in the activity in the network.
Age Consumed metric reflects how many coins changed address during a specific time frame, multiplied by the time since they last moved. When lots of coins have come to motion after being idle for a long time, the spikes appear on the graph.
Historically, the spikes of Aged Consumed precede large price movements in either direction. This metric can be used as a leading indicator of the upcoming price volatility.
Bitcoin's Age Consumed data
 [09.16.16, 29 Sep, 2020]-637369690846868544.png)
Source: Santiment
Let's see what BTC whales are doing to find out where the price may go. According to the Holders' distribution chart, large BTC investors rushed to increase their exposure. The behavioral analytics firm recorded a significant spike in the number of addresses with over 10,000 BTC known as "whales."
Roughly four new whales have joined the network since September 23, with each of them holding from $110 million to $1.1 billion in BTC. Considering their weight, the sudden spike can translate into buying pressure strong enough to take the price above the cluster of technical barriers.
Bitcoin Holders Distribution
 [09.18.38, 29 Sep, 2020]-637369691819280101.png)
Source: Santiment
To conclude: From the technical point of view, BTC/USD recovery is capped by a combination of technical resistance levels. The lack of upside momentum and a slow consolidation below $11,000 demotivates the short-term traders and increases the chances for the downside correction with the critical support created by the upside trend line at $10,300.
On the other hand, the on-chain metrics imply that the big Bitcoin players may be increasing their holdings, which is a strong bullish signal. A sustainable move above $11,200 will negate the bearish scenario and bring the recovery back on track with the ultimate target at 2020 high of $12,500.
Author

Tanya Abrosimova
Independent Analyst



