Bitcoin Price Analysis: BTC bulls aim for $17,000, price due for a correction
- Bitcoin is currently consolidating between strong support and resistance levels.
- The weekly BTC chart is about to flash a sell signal with a green-nine candlestick in the TD sequential indicator.

In one month between October 6 to November 5, the premier cryptocurrency jumped from $10,600 to $15,600. Following that, the price has encountered massive resistance and the buyers and sellers have started engaging in a tug of war for control.
Will Bitcoin breach $17,000?
Currently, BTC is consolidating between strong resistance and support levels. The MACD shows sustained bullish momentum as the price looks to break in the $16,000 zone.
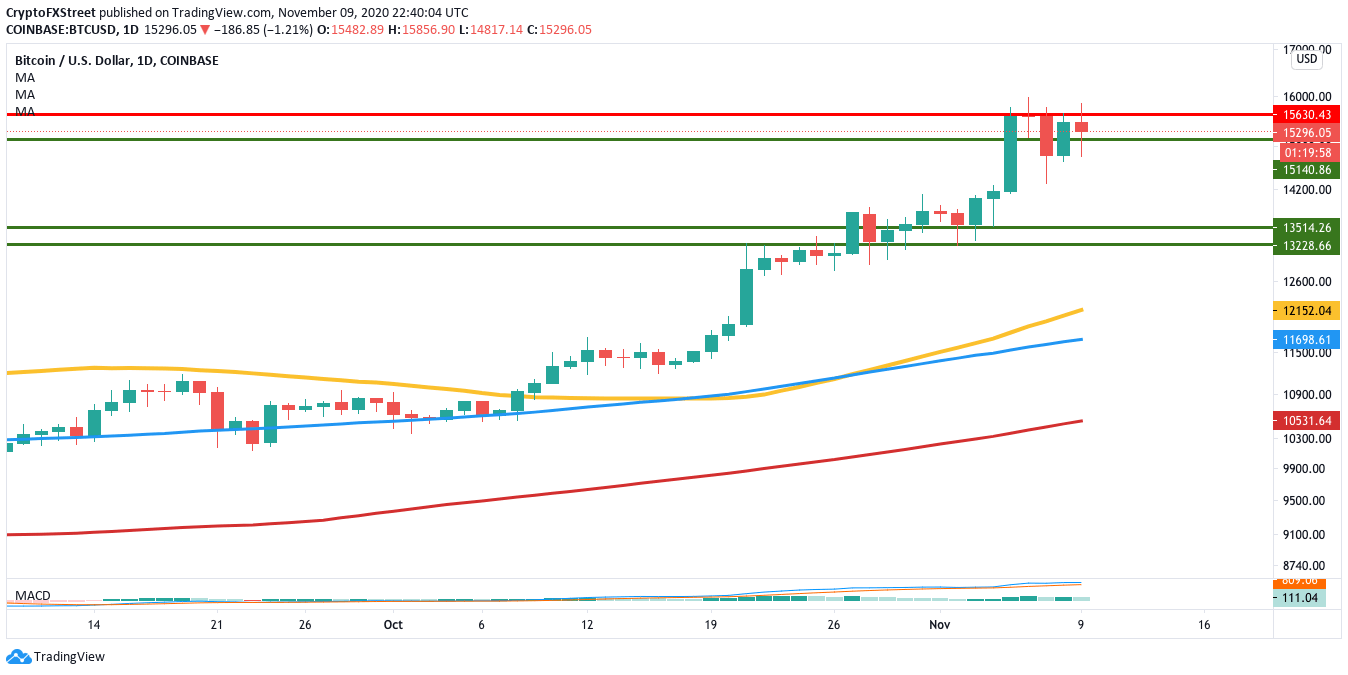
BTC/USD daily chart
Looking at the IOMAP, one can see that the resistance faced by the buyers isn’t as strong as the support wall holding it up. Upon break past the $15,600 resistance, the next viable barrier lies at $16,500. Following that, the price should be able to reach $17,000.
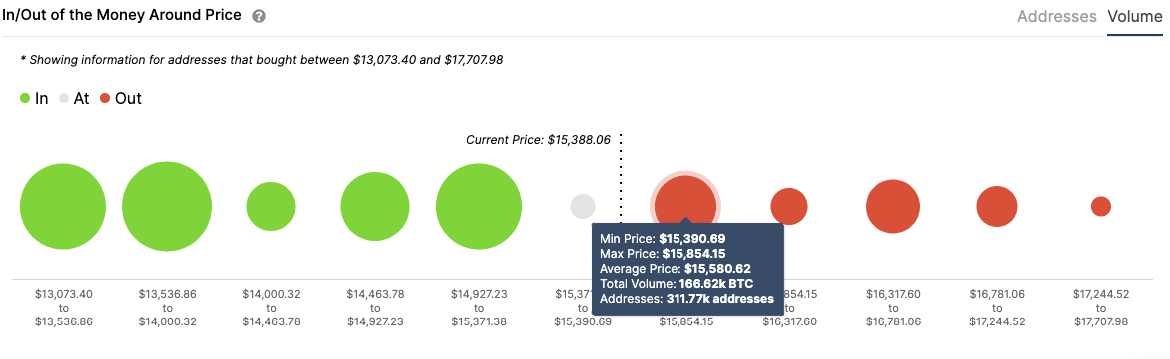
BTC IOMAP
However, Bitcoin’s weekly chart shows us that it is due for a price correction. In fact, not only is the chart on the verge of flashing a sell signal with a green-nine candlestick in the TD sequential indicator, but the relative strength index (RSI) is on the brink of entering the overbought zone. Looking at the price history in this time frame, there looks to be a strong support at $9,900.
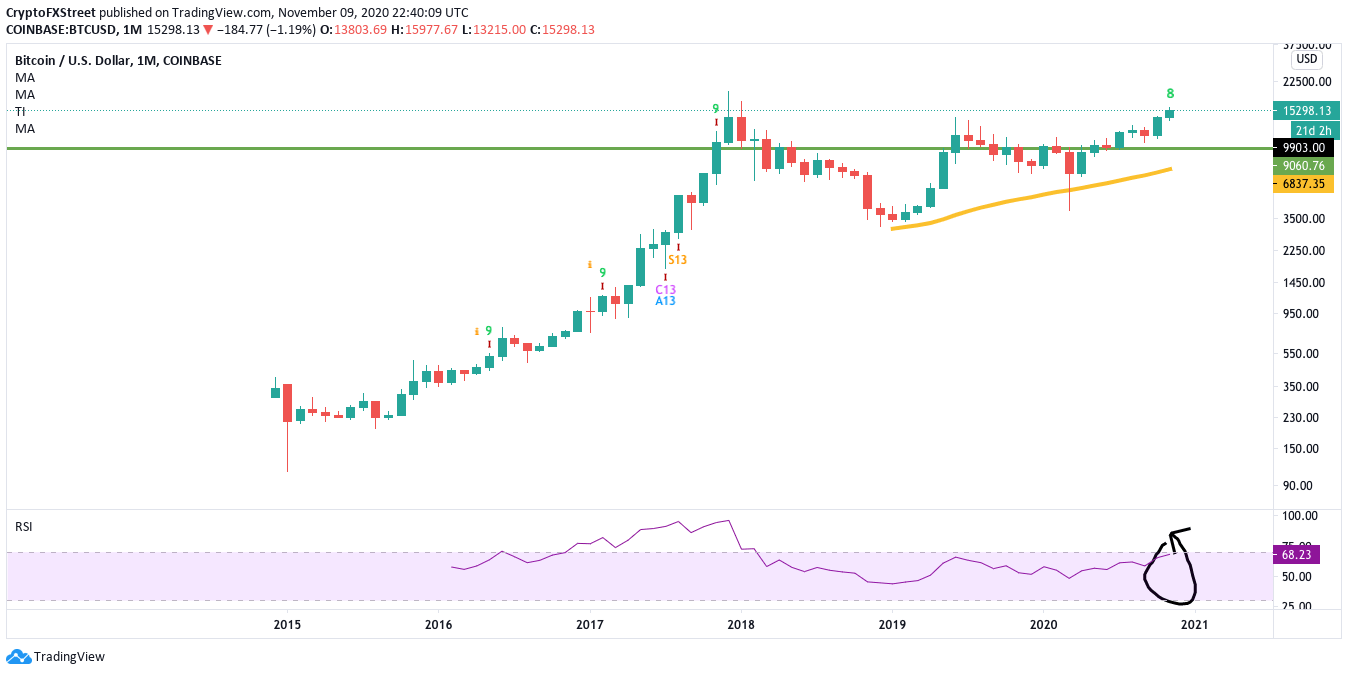
BTC/USD weekly chart
So, while we can expect the price to jump up to $17,000 in the short-term, we can expect BTC to go through a correction in the long-term. As per technical analysis, the downside of this correction is capped off at $9,900.
Author

Rajarshi Mitra
Independent Analyst
Rajarshi entered the blockchain space in 2016. He is a blockchain researcher who has worked for Blockgeeks and has done research work for several ICOs. He gets regularly invited to give talks on the blockchain technology and cryptocurrencies.


