|

Bitcoin perfect reaction higher from blue box area

In this technical blog, we will look at the past performance of the 1-hour Elliott Wave Charts of Bitcoin ticker symbol: $BTCUSD. We presented to members at the Elliott Wave-forecast. In which, the rally from the 11 September 2023 low is unfolding as an impulse structure. Showing a higher high sequence favored more upside extension to take place. Therefore, we advised members not to sell the crypto & buy the dips in 3, 7, or 11 swings at the blue box areas. We will explain the structure & forecast below:

Bitcoin one-hour Elliott Wave chart from 3.18.2024

Bitcoin

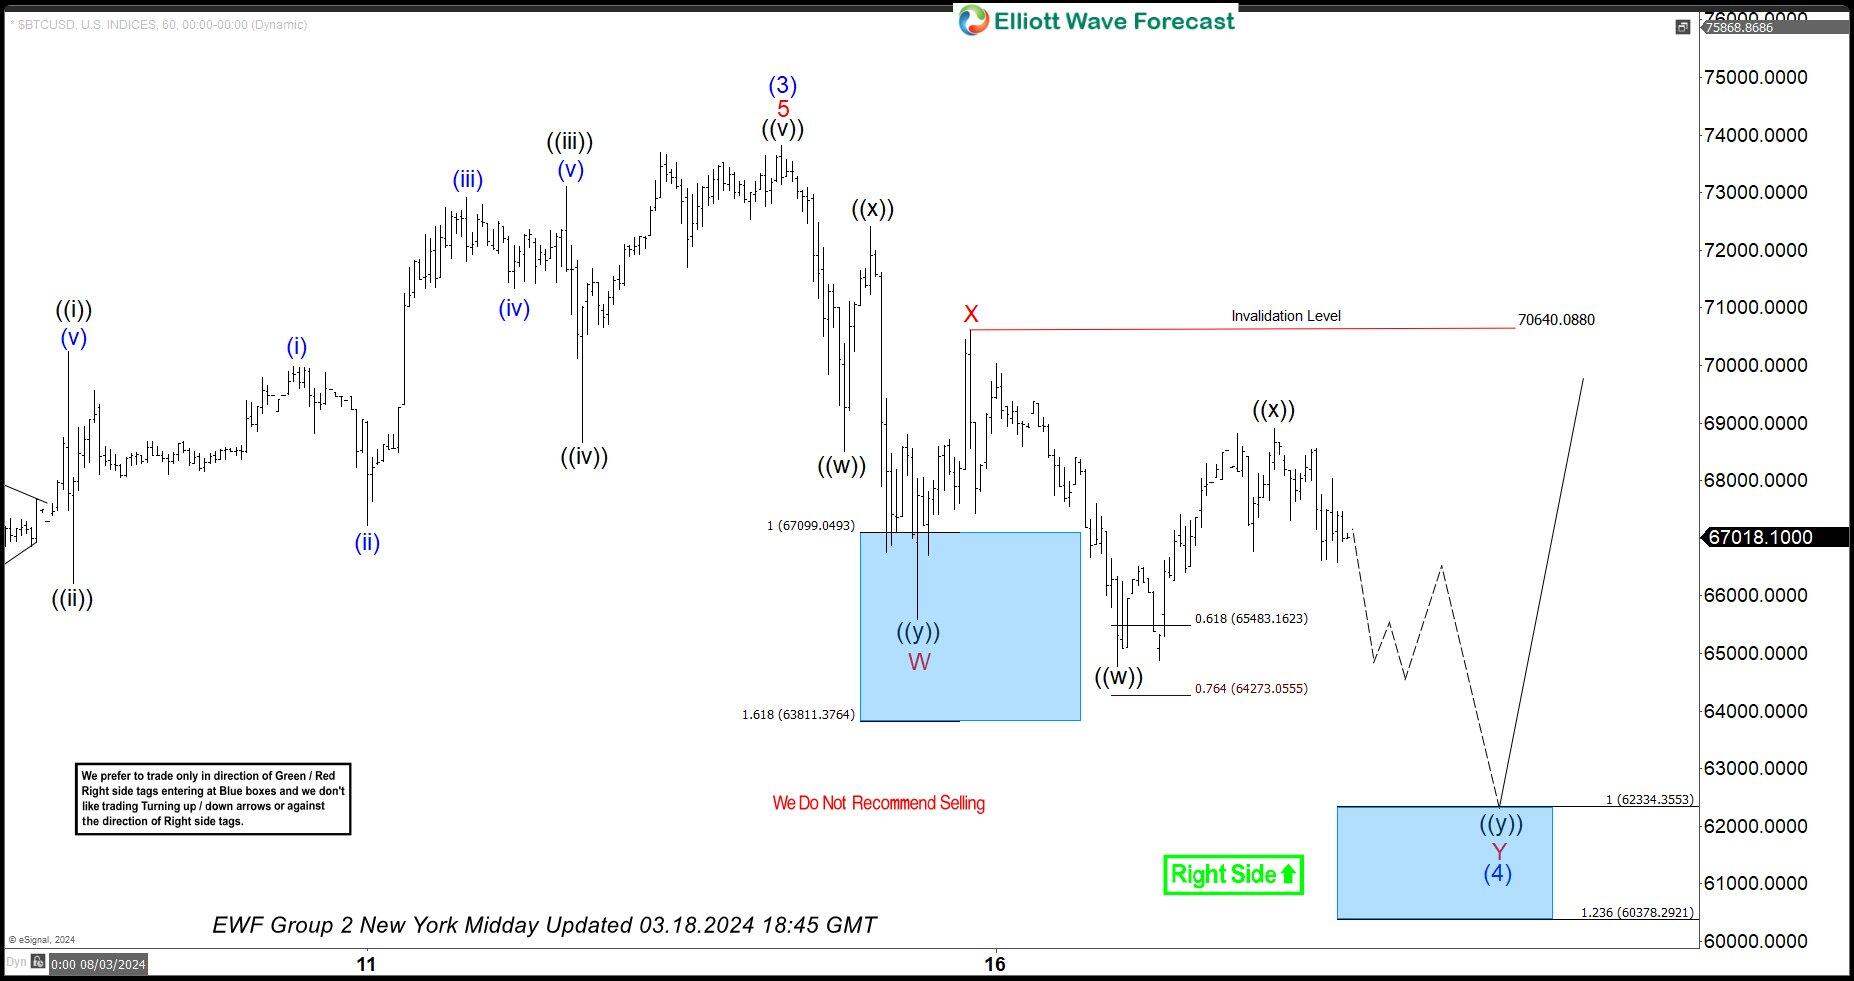
Here’s the 1-hour Elliott wave chart from the 3/18/2024 NY Midday update. In which, the short-term cycle from the 1/23/2024 low ended in wave (3) at $73814 high. Down from there, the BTCUSD made a pullback in wave (4) to correct that cycle. The internals of that pullback unfolded as Elliott wave double three structure where wave W ended at $65595 low. Wave X bounce ended at $70640 high and wave Y managed to reach the blue box area at $62334- $60378. From there, buyers were expected to appear looking for the next leg higher or for a 3 wave bounce minimum.

BTC/USD latest one-hour Elliott Wave chart from 3.26.2024

BTCUSD

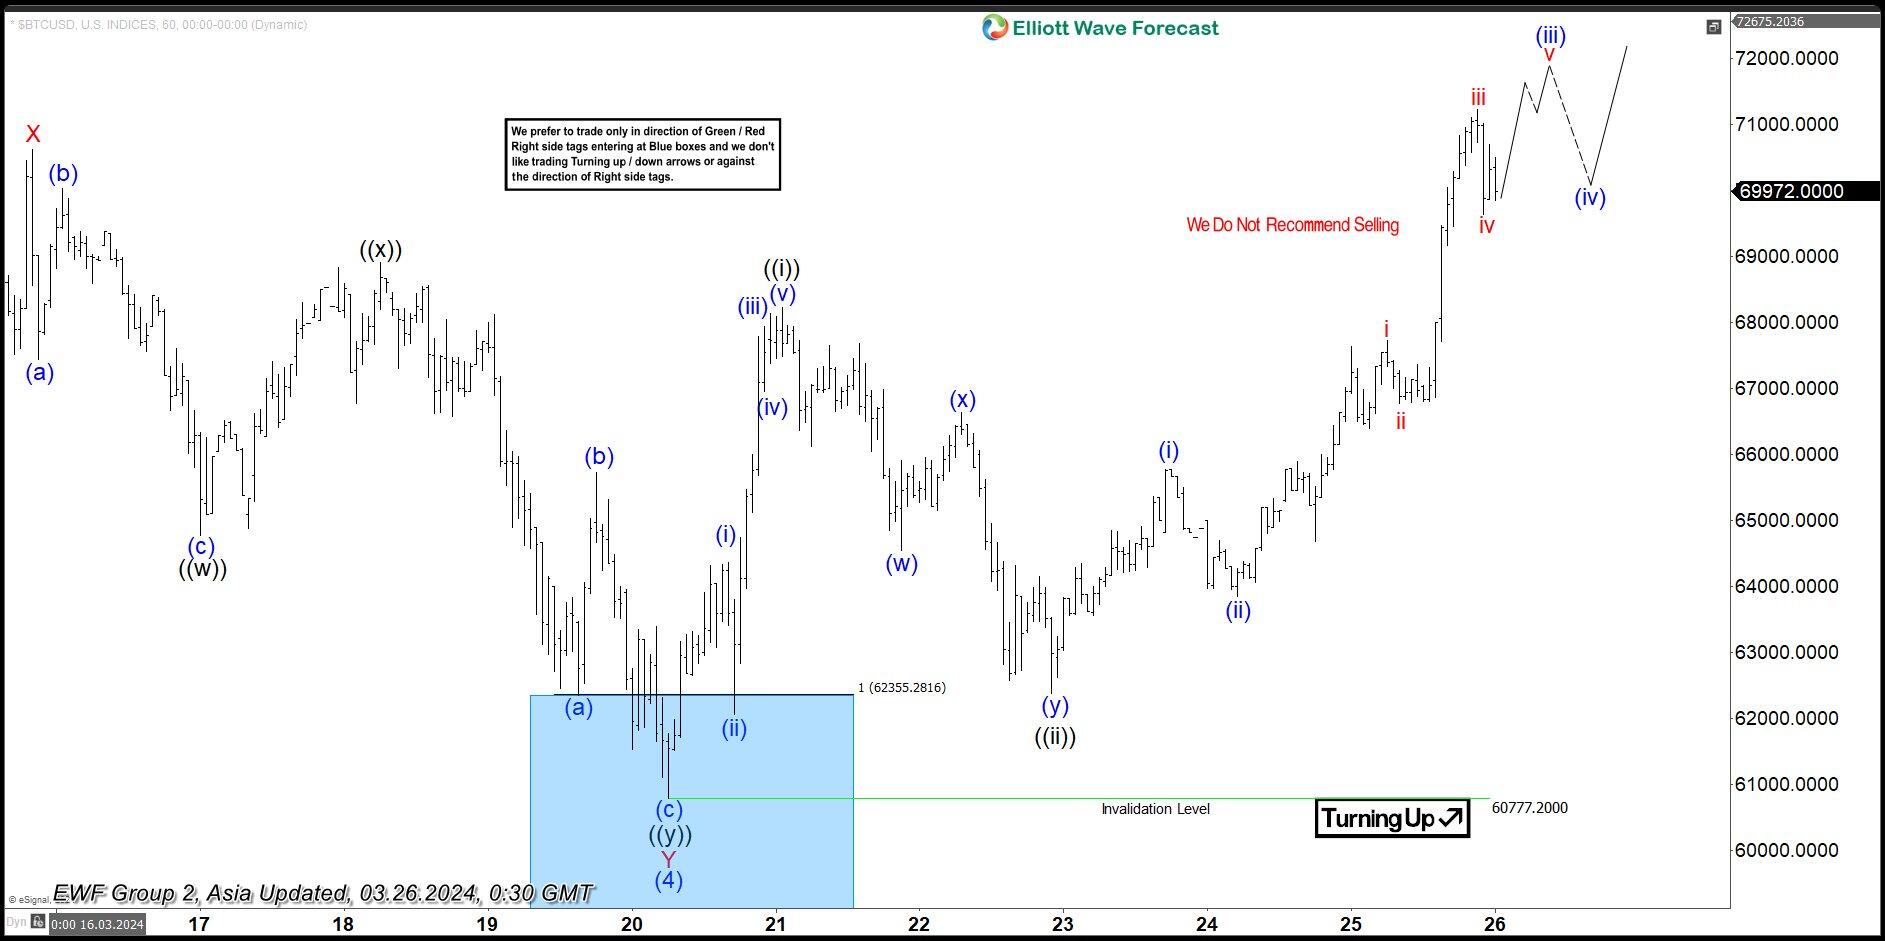
This is the latest 1-hour Elliott wave Chart from the 3/26/2024 Asia update. In which the Bitcoin is showing a reaction higher taking place, right after ending the double correction within the blue box area. Allowed members to create a risk-free position shortly after taking the long position at the blue box area. However, a break above $73814 high is still needed to confirm the next extension higher towards $73822- $76901 & avoid a double correction lower.

Author

Elliott Wave Forecast Team

Elliott Wave Forecast Team

ElliottWave-Forecast.com

More from Elliott Wave Forecast Team
Share:

Editor's Picks

Ripple Price Forecast: XRP potential bottom could be in sight

Ripple edges up above the intraday low of $1.35 at the time of writing on Friday amid mixed price actions across the crypto market. The remittance token failed to hold support at $1.40 the previous day, reflecting risk-off sentiment amid a decline in retail and institutional sentiment. 

Crypto Today: Bitcoin, Ethereum, XRP in choppy price action, weighed down by falling institutional interest 

Bitcoin holds above support at $65,118 at the time of writing on Friday. Ethereum remains choppy in a narrow range between support at $1,900 and resistance at $2,000, while Ripple attempts another upward move toward the pivotal $1.40 level.

PancakeSwap Price Analysis: Bearish momentum suggests further downside

PancakeSwap (CAKE) is trading below $1.26 at the time of writing on Friday, extending the losses by over 8% so far this week. The weakening derivatives market further supports the bearish outlook, with bears aiming for levels below $1.18.

Decred Price Forecast: DCR rebounds toward key resistance zone on volume spike

Decred (DCR) rebounds over 7% at press time on Friday after a three-day decline of almost 14%. Roughly 60% increase in trading volume over the last 24 hours supports the recovery, suggesting heightened spot-market demand. 

Bitcoin Price Annual Forecast: BTC holds long-term bullish structure heading into 2026

Bitcoin (BTC) is wrapping up 2025 as one of its most eventful years, defined by unprecedented institutional participation, major regulatory developments, and extreme price volatility.

Bitcoin: BTC bears aren’t done yet

Bitcoin (BTC) price slips below $67,000 at the time of writing on Friday, remaining under pressure and extending losses of nearly 5% so far this week.