Bitcoin Gold price analysis: BTG/USD jumps 2%; could climb above $20.00
- Bitcoin Gold price is currently trading between the hourly simple moving average support and resistance.
- Technical indicators like the Relative Strength Index and the MACD are showing positive signals.

Bitcoin Gold is among the few coins trading in the green on Friday. The crypto has come under excessive selling pressure in the past few weeks. It recently traded lows slightly above $17.50 but has also remained stable above the short-term support at $18.00.
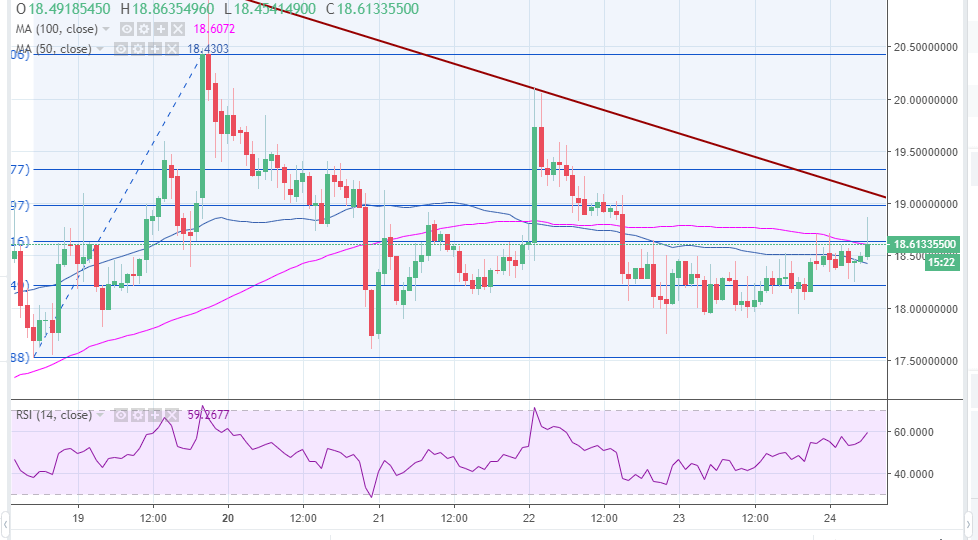
There was an upside movement that corrected higher above $20.00 but reversed on trading highs around $20.50. BTG/USD upside has been capped below the trendline resistance but the trading in the past couple of days has been more of upward sideways. The price is currently trading between the hourly simple moving average support and resistance. Consequently, the 38.2% Fib retracement level at $18.63 is limiting the gains towards the immediate supply zone at $19.00 (50% Fib level).
The indicators like the Relative Strength Index (RSI) and the MACD are showing positive signals. The RSI is advancing upwards above 50% while the MACD is just above the zero mark in the positive zone. Looking at the chart, BTG is likely to break the short-term resistance at the 38.2% Fibo. This will allow it to recoil towards $19.00 and eventually above $20.00. On the other hand, the price is anchored at $18.00, but the previous lows at $17.50 will stand ground in the event the trend reverses south.
BTG/USD 1-hour chart
Get 24/7 Crypto updates in our social media channels: Give us a follow at @FXSCrypto and our FXStreet Crypto Trading Telegram channel
Author

John Isige
FXStreet
John Isige is a seasoned cryptocurrency journalist and markets analyst committed to delivering high-quality, actionable insights tailored to traders, investors, and crypto enthusiasts. He enjoys deep dives into emerging Web3 tren


