Bitcoin Gold Price Analysis: BTG/USD bulls wake up after bouncing off key trendline support
- Bitcoin Gold bounces off trendline support in a bid to avert further loses after a rejection from the resistance at $10.00.
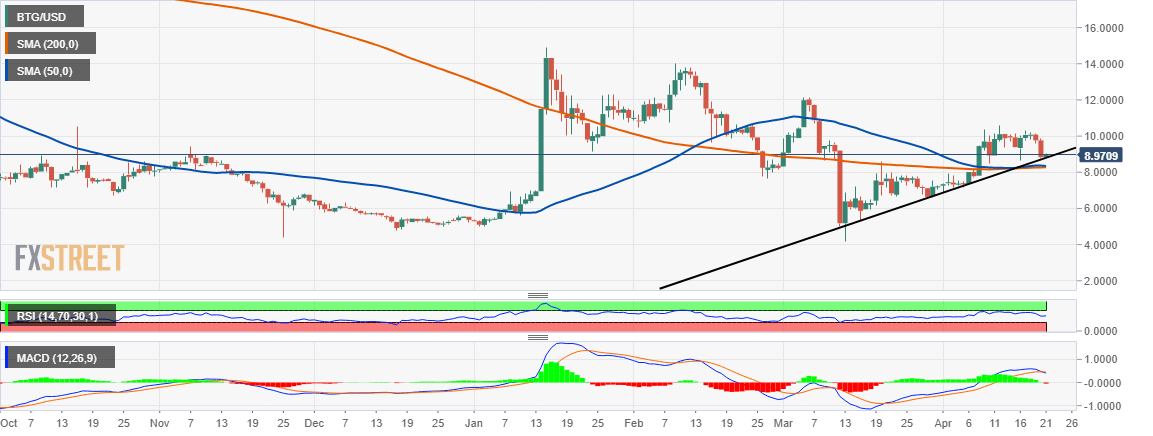
- BTG/USD step above the 50-day SMA and the 200-day SMA hints towards a possible breakout above $10.00.

Bitcoin Gold (BTG) is once again in the green after retreating from the wall it hit at $10.00. Luckily the bulls’ concentration at an ascending trendline prevented further declines. Moreover, the price is trading above the moving averages where both the 50-day SMA and the 200-day SMA have formed a confluence around $8.35. A bullish momentum continues to build above the trendline support in spite of the digital asset growing by 2.45% on the day to trade at $9.05.
A glance at Bitcoin Gold’s technical levels, one sees an asset strongly in the hands of the bulls. The MACD in the daily range is sitting comfortably in the positive region after a gradual but steady recovery from lows around -1.10 on March 12 and March 13 amid the Coronavirus triggered selloff.
On the other hand, the RSI shows that BTG/USD is settling in sideways action above $9.00 support. The indicator retreated from highs close to 70 last week only to find refuge at 50. On the upside, gains above $10.00 are possible, besides they would play a vital role in pulling Bitcoin Gold to levels past $14.00 (next hurdle) and $20.00 (psychological level).
BTG/USD daily chart

Author

John Isige
FXStreet
John Isige is a seasoned cryptocurrency journalist and markets analyst committed to delivering high-quality, actionable insights tailored to traders, investors, and crypto enthusiasts. He enjoys deep dives into emerging Web3 tren


