Bitcoin enters structural stress test as BTC/USD retraces from 125,000 highs

BTC/USD trades below prior acceptance zones as long-term supply-and-demand structure comes back into focus.
BTC/USD — MacroStructure desk observation
Daily timeframe | Yearly structural blocks | Supply–Demand mapping
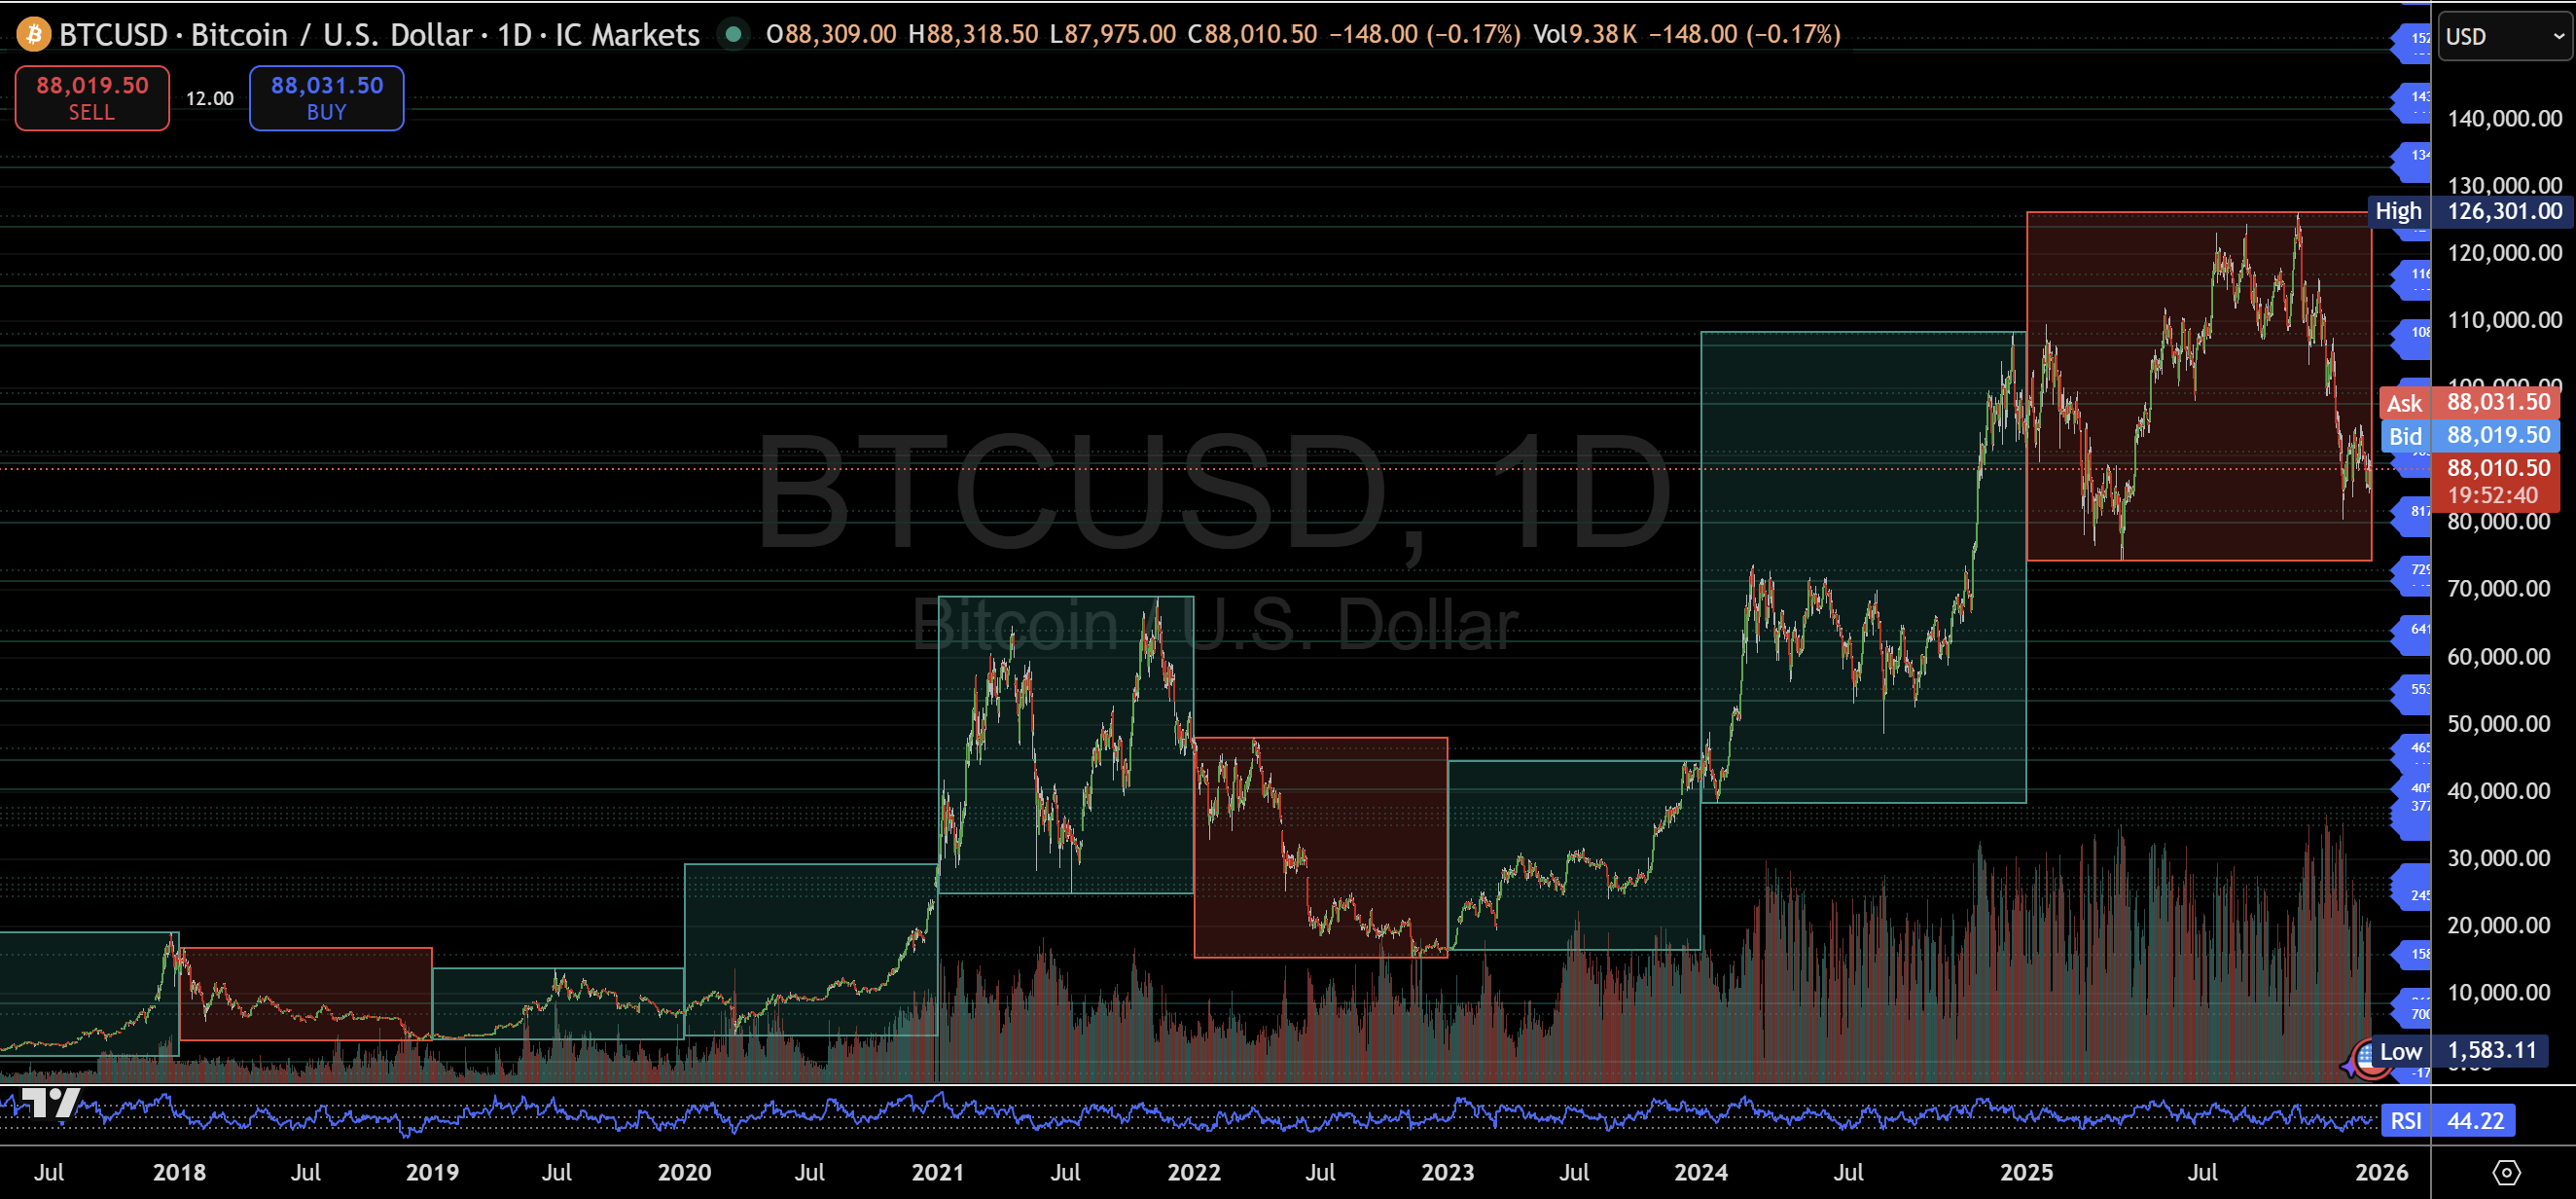
This chart maps Bitcoin’s structural evolution from 2017 to present using year-block and daily MacroStructure supply-and-demand zones, illustrating how price has consistently respected measured rotations, block symmetry, and phase sequencing, independent of narrative or sentiment.
The objective is not to forecast, but to document how price has behaved historically and how it currently interacts with predefined structures.
MacroStructure phases: Balance → Expansion → Rotation → Stress test
1. 2017–2020: Balance and base formation
From 2017 through 2020, BTC/USD traded in a broadly balanced environment, oscillating between:
- Highs: ~13,000
- Lows: ~3,000
Price rotated evenly within this range, showing repeated acceptance rather than directional expansion. Structurally, this period served as a long-term base, with supply and demand largely in balance.
2. Late 2020: Expansion regime shift
By late 2020, BTC/USD decisively transitioned from Balance to Expansion.
This shift introduced:
- Directional block sequencing
- Repeated patterns of advance → rotation → continuation
- Sustained acceptance beyond prior value zones
This regime change established the measured-move framework that has governed both advances and declines since.
3. 2020–Mid-2021: Expansion cycle I
From late 2020 into mid-2021:
- Advance: ~8,000 → ~62,000
- Structure: ~6 supply-and-demand blocks
This phase marked Bitcoin’s first complete Expansion cycle, defining the cadence of impulse, rotation, and continuation.
4. Mid- to Late-2021: Rotation and re-acceptance
Still in 2021, price experienced:
- A ~50% pullback
- A Rotation back toward prior highs
- Approximately 4 internal supply-and-demand blocks
This phase reflected re-acceptance rather than structural failure, before BTC/USD printed a cycle high near 68,000 in November 2021.
5. Nov 2021 – Jan 2023: Downside expansion
Following the November 2021 peak:
- Measured move: ~68,000 → ~15,000
- Structure: ~6 supply-and-demand blocks
This was a full-scale downside Expansion, not a disorderly collapse. Price respected downside symmetry consistent with prior Expansion phases, confirming Bitcoin’s transition into a two-sided, structurally governed market.
6. Jan 2023 – Mar 2024: Expansion cycle II (recovery phase)
From January 2023 through March 2024:
- Advance: ~15,000 → ~72,000
- Structure: ~6 blocks
This recovery phase mirrored earlier Expansion cycles, reinforcing the consistency of the MacroStructure framework.
7. Mar 2024: Shallow rotation
After reaching ~72,000 in March 2024:
- Pullback: ~72,000 → ~55,000
This Rotation was notably shorter and shallower than prior corrections, suggesting strong demand absorption rather than broad distribution.
8. Sep – Dec 2024: Late-stage expansion
From September to December 2024:
- Advance: ~55,000 → ~108,000
- Structure: ~6 supply-and-demand blocks
This phase was characterised by compressed rotations and rapid follow-through, typical of late-stage Expansion rather than early trend development.
9. Jan – Aug 2025: Expansion extension and volatility compression
In 2025, BTC/USD experienced:
- A ~50% pullback
- Followed by an advance to new highs near 125,000
Price action during this phase showed increasing volatility and structural compression, often observed when markets extend far beyond long-term value zones.
10. Compression → Expansion sequencing (structural overlay)
Across every major cycle since 2020, a consistent sequence has emerged:
- Expansions followed prolonged volatility compression.
- Accelerated moves emerged after shallow Rotations.
- The most aggressive declines followed compressed upside Expansions.
The 2024–2025 advance displayed these same characteristics. The subsequent decline from ~125,000 unfolded rapidly, reflecting structural release following compression, rather than gradual distribution.
The speed of the 125,000 → 81,000 decline is therefore a structural signal in itself, independent of direction.
11. Oct 2025 – Present: Structural stress test
As of December 20th 2025, BTC/USD trades near 88,000.
Key structural observations:
- Price has declined approximately 5 supply-and-demand blocks from ~125,000 to ~81,000
- A full 6-block measured move projects toward the ~74,000 region, aligning with April 2025 lows
- This zone represents a major structural reference, based on historical symmetry rather than directional bias.
A large portion of 2025’s gains has been erased in a short time window, marking a shift from orderly Expansion into Stress Test conditions.
12. Current conditions: Stress test levels in focus
- BTC/USD is attempting to stabilise, but remains below multiple prior acceptance zones
- Initial resistance band: ~90,570 → ~100,000
- Sustained acceptance above 100,000 would suggest Rotation rather than continuation lower, reopening higher structural references.
Conversely:
- Failure to hold the ~74,000 region would complete the current downside Expansion.
- Below that, the structure exposes:
- ~55,000 (September 2025 lows)
- ~46,000, the February 2024 supply-and-demand breakout level that preceded the rally to 108,000
Desk summary
- Bitcoin has respected measured supply-and-demand symmetry across every major cycle since 2020
- The current phase represents a late-cycle Structural Stress Test, not an anomaly.
- Key levels are already defined by historical price behaviour.
- The task remains to observe how price responds at structure, rather than to anticipate outcome.
Structure defines the battlefield.
Levels exist before price arrives.
Document response, not prediction.
Author

Denis Joeli Fatiaki
Independent Analyst
Denis Joeli Fatiaki possesses over a decade of extensive experience as a multi-asset trader and Market Strategist.


